Figure 5.
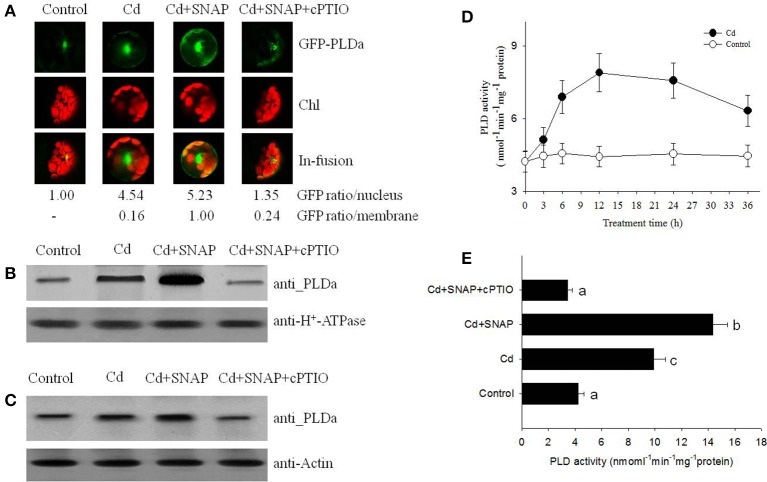
NO promotes cadmium-induced PLD protein migration and its enzyme activity. (A) GFP fluorescence in rice protoplasts transiently expressing PLDa-GFP fusion protein. Control, untreated; Cd, treated with 10 μM cadmium for 12 h; Cd+SNAP, treated with 10 μM cadmium plus 30 μM SNAP for 12 h; Cd+SNAP+cPTIO, treated with 10 μM cadmium plus 30 μM SNAP and 30 μM cPTIO for 12 h. From left to right: Flu, GFP fluorescence; BF:bright field; Merge (Flu+BF): merged image of FLU and BF. The GFP fluorescence intensity in the nucleus and membrane were quantified by Image J software (http://rsb.info.nih.gov/ij/download.html). (B,C) Western blotting and an anti-PLD antibody assay to detect PLDa accumulation in the enriched plasma membrane protein (B) and the total proteins (C). Third-leaf-stage rice seedlings were treated with 10 μM cadmium with or without 30 μM SNAP or 30 μM cPTIO for 1 day. The enriched plasma membranes proteins and total proteins were isolated for PLD content analysis. (D,E) The rice seedling at three leaf stage were treated with 10 μM cadmium, the time course of PLD activity with (closed circle) or without Cd stress (open circle) were measured (D), and the effect of different chemicals on PDL activity were measured after 1 day of treatment (E). Values reflect means ± SEs of three independent experiments (n = 10/experiment). Different symbols above the bars indicate significant differences (Tukey's test, p < 0.05).

