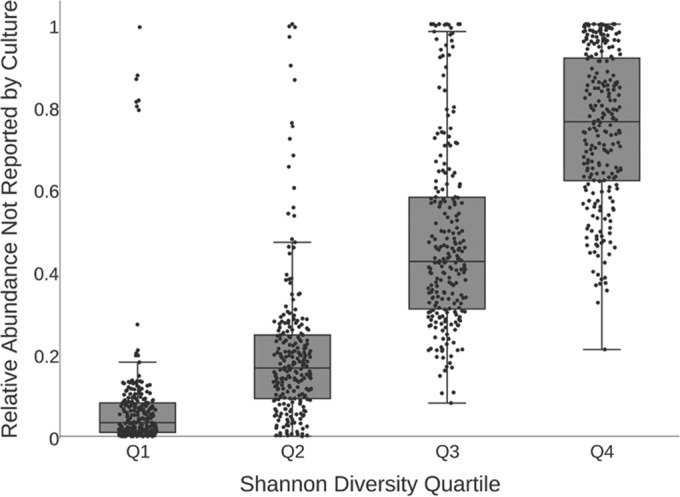
FIG 5.

Box plot showing the relative abundances (summed) of the genera not reported by culture and grouped by Shannon diversity quartiles. The black line corresponds to the median summed relative abundance for each diversity quartile (1, low diversity; 4, high diversity). Each black dot represents one sputum sample.
