FIGURE 7.
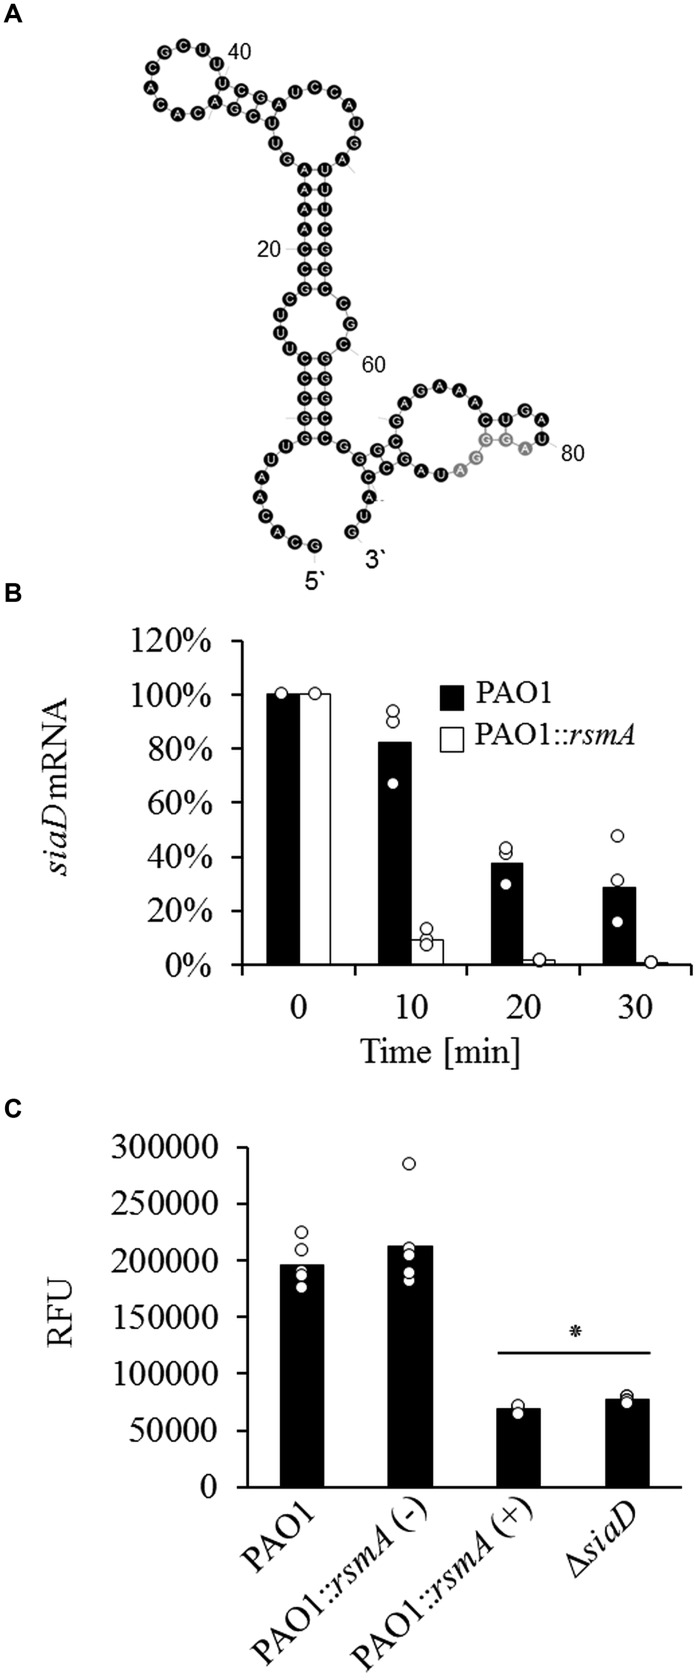
(A) Structural prediction of the siaABCD leader sequence using mFold (Zuker, 2003) with the predicted primary RsmA binding site (gray) (B) Impact of RsmA overexpression on the stability of siaD mRNA as determined by qRT-PCR. Data were normalized by the use of equivalent mRNA and analyzed by the 2-ΔCt method. (C) c-di-GMP levels of cells quantified as relative fluorescence units (RFU with excitation/emission of 485/535 nm) normalized to optical density by using the pCdrA::gfpc reporter for the wild-type, PAO1::rsmA [with (+) and without (-) RsmA induction (2% arabinose)], and the ΔsiaD strains. Bars represent the mean value from three (B) or six (C) individual experiments and are accompanied by the individual data points. Statistical significance compared to strain PAO1 and PAO1::rsmA is indicated (∗p = 0.001).

