Figure 6.

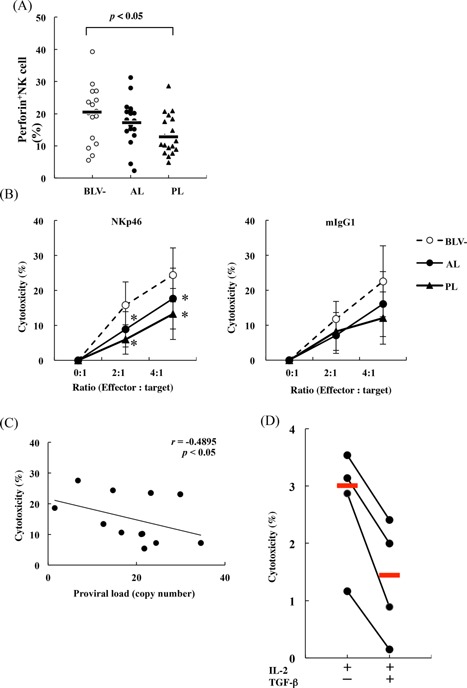
Decreased perforin production (A: BLV(−): n = 16, AL: n = 18, PL: n = 18) and cytotoxicity (B BLV(−): n = 7, AL: n = 5, PL: n = 7) of NK cells in BLV‐infected cattle with PL. Asterisks donate significant differences between the cytotoxicity of NK cells from infected and uninfected cattle (*p < 0.05); (C) Negative correlations between NK cytotoxicity and proviral loads in the BLV‐infected cattle (n = 12); (D) Inhibition of NK cytotoxicity by TGF‐β (n = 4).
