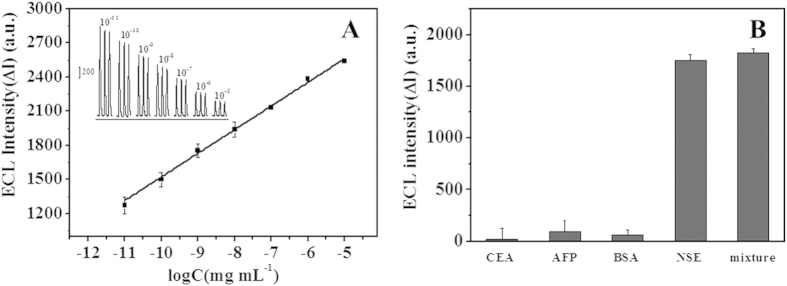
Figure 6.
(A) Calibration curve of decrease value of ECL intensity (ΔI) to logarithmic NSE concentration. Insert: ECL− time curves of the immunosensor incubating with 1.0 × 10⁻¹¹ mg mL−1, 1.0 × 10⁻¹⁰ mg mL−1, 1.0 × 10⁻⁹ mg mL−1, 1.0 × 10⁻⁸ mg mL−1, 1.0 × 10⁻⁷ mg mL−1, 1.0 × 10⁻⁶ mg mL−1 and 1.0 × 10⁻⁵ mg mL−1 NSE. (B) ECL responses of the proposed immunosensor incubating with 2.0 × 10⁻⁸ mg mL−1 of CEA, AFP, BSA, 1.0 × 10⁻⁹ mg mL−1 of NSE and their mixture. The ECL response was determined in 0.1 M PBS (pH 7.5); Scan rate: 100 mV s−1. Scan potential: 0~1.35 V.

