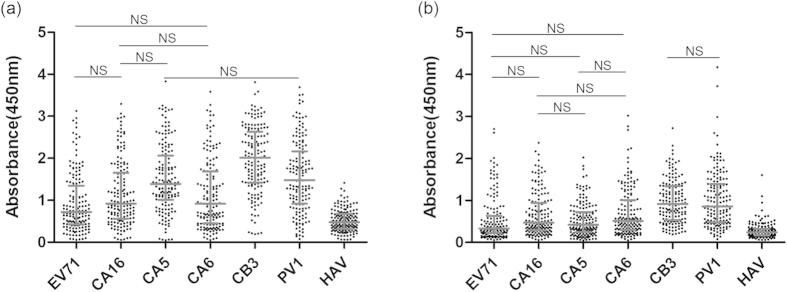
Figure 2.
Comparison of the antibody reactivity against VP1 of EV71, CA16, CA5, CA6, CB3, PV1 and HAV in serum samples in August 2013 (a) and May 2014 (b). Each symbol represents an individual sample, and the lines indicate X25%, X50% and X75% value of the group from the bottom to the top, respectively. “NS” represents no significant difference between the two groups. The differences were significantly different between the other groups.

