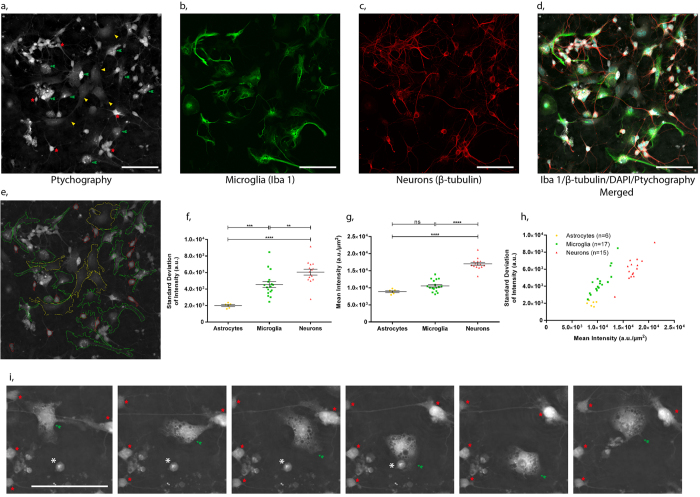
Figure 2. Correlative microscopy and quantitative analysis of ptychographic phase images.
(a) Ptychographic phase image of the live primary hippocampal culture was acquired prior to fixation, where microglia (green arrows), neurons (red stars) and astrocytes (yellow triangles) are easily distinguished. Following fixation correlative confocal images from the same field of view show (b) microglia labelled with Iba1, (c) hippocampal neurons labelled with β-tubulin and (d) a merged image of Iba1, β-tubulin, DAPI labelled cells overlaid with the ptychographic phase image. The remaining unlabelled population of cells represent astrocytes in the culture. (e) Segmentation of the individual cell types (microglia-green, neurons-red and astrocytes-yellow). (f) Standard deviation of pixel intensity, (g) mean intensity and (h) and the relationship between the two parameters for each segmented cell (one way ANOVA with Tukey’s post-hoc test, ****p < 0.0001, ***p < 0.001, **p < 0.01). (i) Ptychographic phase images from a time-lapse sequence clearly showing the phagocytic activity of microglia (indicated by a green arrow) towards an apoptotic neuron (indicated by an asterisk). Healthy neurons are indicated by a red star. Further examples of phagocytic activity in supplementary video S2.

