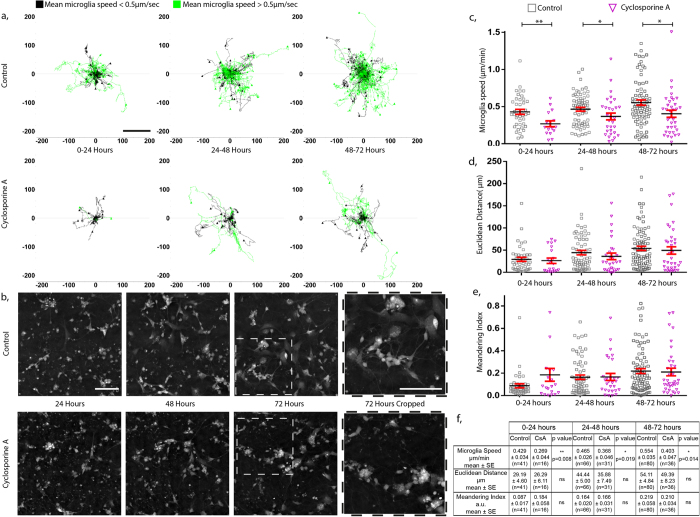
Figure 3. Quantifying and measuring microglia activity.
(a) Activity of microglia from 3 independent rodent neuronal cultures was measured over a period of 72 hours following treatment with 1 μM cyclosporine A and compared to control conditions. Tracks of individual microglia are plotted from their point of origin (μm) in each 24 hour window over the 72 hour period. Tracks in black represent microglia that possess a mean speed that is less than 0.5 μm/min whilst those in green have a mean speed greater than 0.5 μm/min. (b) Representative images at each 24 hour time point show the development and the maturation of both control and cyclosporine A treated neuronal cultures (full time-lapse videos available as supplementary videos S3 and S4). Quantitative parameters relating to the microglia activity such as; (c) speed; (d) Euclidean distance and (e) meandering index were calculated for multiple microglia from both the control and cyclosporine A treated neuronal cultures during each time period. (f) These values are summarised in a table form (Mann-Whitney non-parametric test of significance, **p < 0.01, *p < 0.05).

