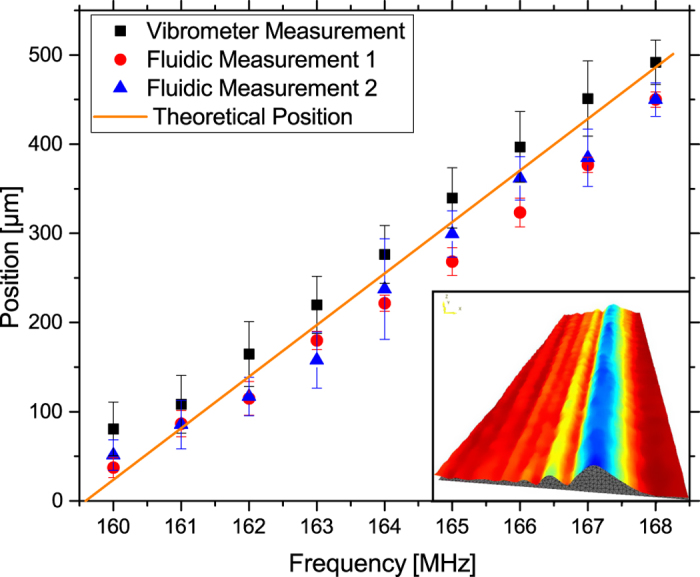
Figure 3. Comparison of the position of the acoustic path determined from our new fluidic visualization method, vibrometer measurements and calculated values (with SAW velocity of 3870 m/s41).

The position of the acoustic path is shifted linearly with the frequency. The slopes of the fit for each method are in good agreement with each other: 51.06 ± 1.45 μm/MHz (fluidic measurement 1), 51.36 ± 1.94 μm/MHz (fluidic measurement 2), 53.62 ± 1.18 μm/MHz (vibrometer measurement) and 57.79 μm/MHz (theory). The SAW velocity is slightly changed by the thin liquid film, which is reflected by the small offset between fluidic measurements and theory. The intensities of the acoustic path were fitted with a Gaussian function and the errors are given by half width of the half maximum (1/2 FWHM). The inset shows an exemplarily vibrometer measurement.
