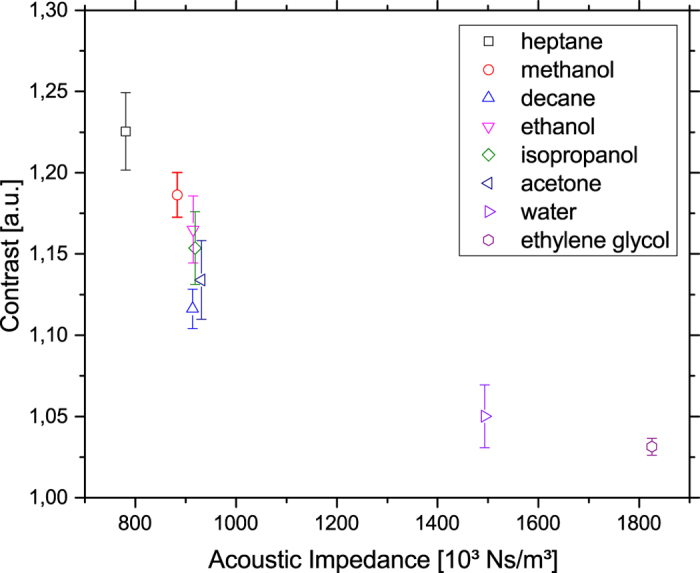
Figure 7. Optical contrast as given by the ratio of the grey values of the maximum and the baseline plotted against the acoustic impedance for different fluids.

The optical contrast decreases with higher acoustic impedance. Experimental points show the mean value with standard deviation.
