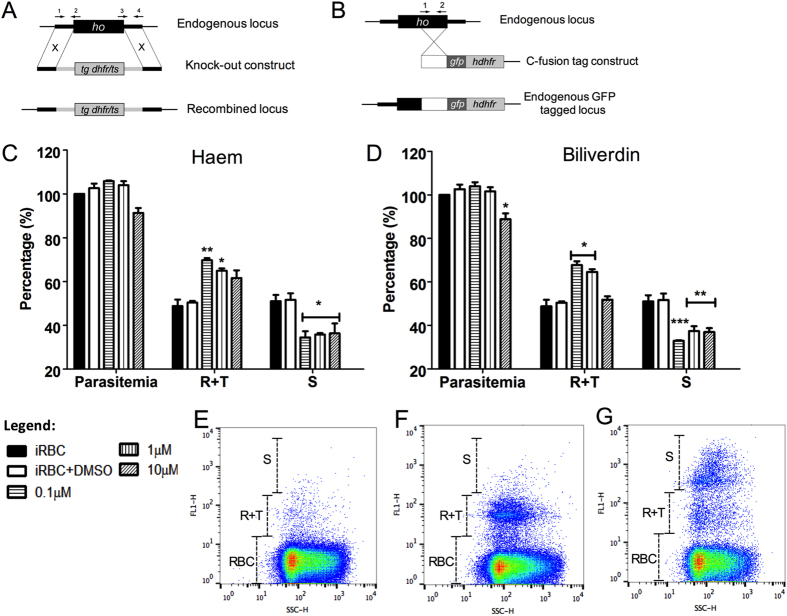
Figure 2. Multiple strategies to investigate the function of haem oxygenase and effects of haem and biliverdin during erythrocytic development of Plasmodium.
(A) Schematic representation of the gene targeting strategy used for gene disruption via double homologous recombination in P. berghei. Primers 1 to 4 used for PCR of 5′ and 3′ fragments for knockout construct are indicated. (B) Schematic representation of the gene-tagging construct used for tagging of the endogenous pbho locus in P. berghei by single homologous recombination with gfp. Primers 1 and 2 used for amplifying the endogenous locus are indicated. (C) P. falciparum intraerythrocytic modulation during 48 hours of incubation with haem. Parasitaemia value of the control with no drugs or solvent (iRBC) was considered 100%. All treatments were compared with the control containing only solvent (iRBC + DMSO). iRBC + DMSO values: parasitaemia 103 ± 2%; R + T: 50 ± 1% and S: 52 ± 5%. Haem graphic, parasitaemia values: 0.1 μM (99 ± 3%); 1 μM (97 ± 5%); 10 μM (91 ± 2%). R + T values: 0.1 μM (70 ± 1%); 1 μM (64 ± 1%); 10 μM (62 ± 4%). S values: 0.1 μM (35 ± 3%); 1 μM (36 ± 1%); 10 μM (36 ± 4%). (D) BV graphic, parasitaemia values: 0.1 μM (104 ± 2%); 1 μM (98 ± 4%); 10 μM (89 ± 3%). R + T values: 0.1 μM (68 ± 1%); 1 μM (65 ± 1%); 10 μM (52 ± 2%). S values: 0.1 μM (33 ± 1%); 1 μM (37 ± 2%); 10 μM (37 ± 2%). The graphs in C and D represent means and standard error of three independent experiments. *P < 0.05%, **P < 0.01% and ***P < 0.001%. (E) Dot plot depicts a typical gating population of non-infected RBCs (RBC). (F) Dot plot depicts a typical gating population of RBCs and infected RBCs with mononucleated parasites (R + T). (G) Dot plot depicts a typical gating population of RBCs, R + T and infected RBCs with multinucleated parasites (S).

