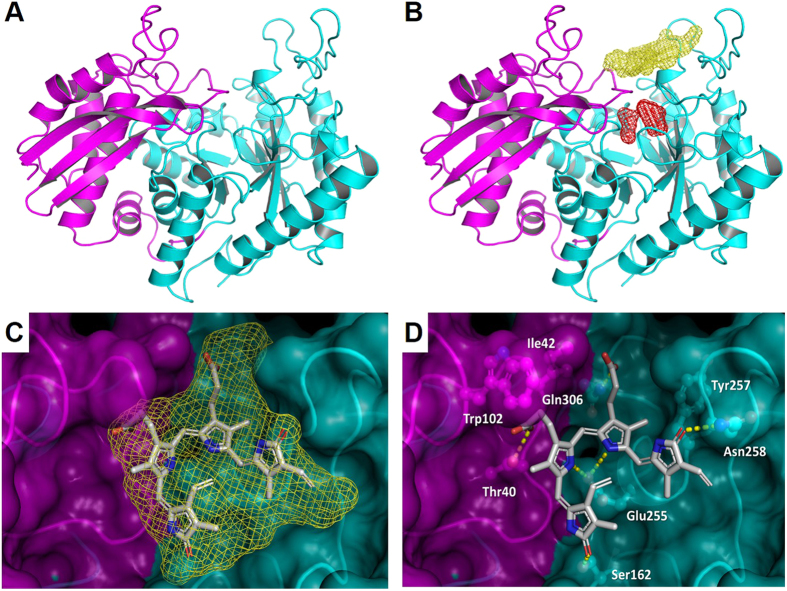
Figure 5. Pf enolase molecular modelling.
Pf enolase 3D modelling. (A) Pf enolase homology model (N-terminal domain = magenta; C-terminal domain = cyan). (B) Pf enolase envelopes for binding cavities identified by SiteHound (catalytic site = red mesh; dimer interface cavity = yellow mesh). (C) Modelled binding mode of BV (stick model) into Pf enolase putative cavity envelope (yellow mesh). (D) Detailed view of BV modelled binding mode (hydrogen bonds = yellow dashes; protein residues = ball and stick model).

