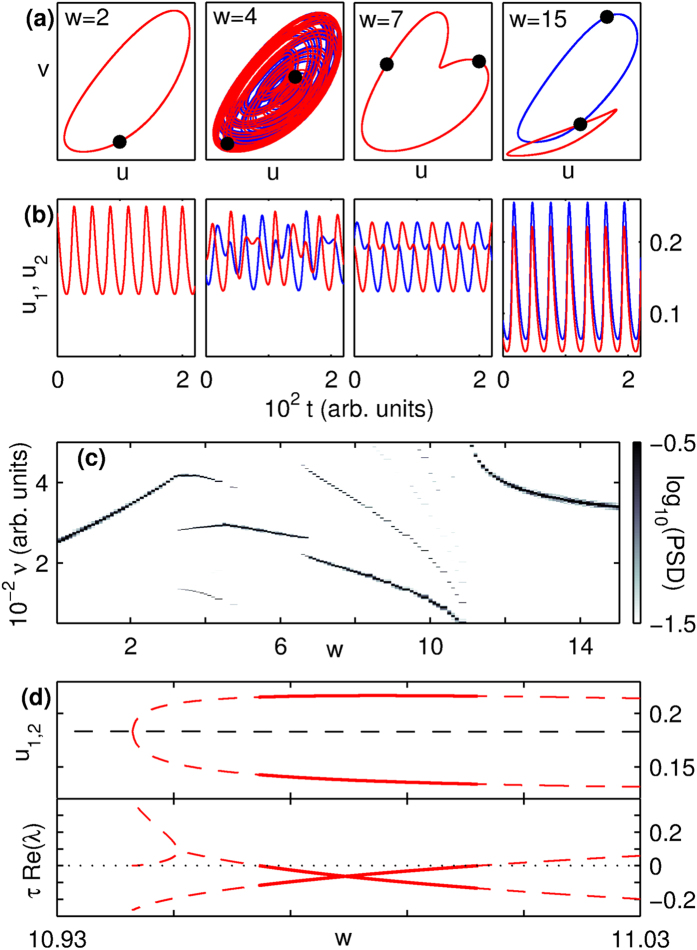
Figure 2. Collective dynamics of a system of two coupled WC oscillators.
(a) Phase space projections of the trajectories and (b) time-series for each oscillator showing exact synchronization (ES, for coupling w = 2), quasiperiodicity (QP, w = 4), anti-phase synchronization (APS, w = 7) and inhomogeneous in-phase synchronization (IIS, w = 15). The filled circles represent the location of each oscillator in phase space at a time instant. The panels in (a) are scaled individually for better visualization. (c) Power-spectral density (PSD) of the time-series for the u component of each oscillator, revealing the dominant frequencies as a function of w. (d) Excitatory components of the fixed points of the system (upper panel) and the real parts of the eigenvalues corresponding to the heterogeneous fixed points (lower panel) showing the transitions between APS and IIS regimes (see Supplemental Material), where τ = τu,v = 8. Solid (broken) lines represent stable (unstable) solutions. The horizontal broken line (upper panel) represents the unstable homogeneous solution.

