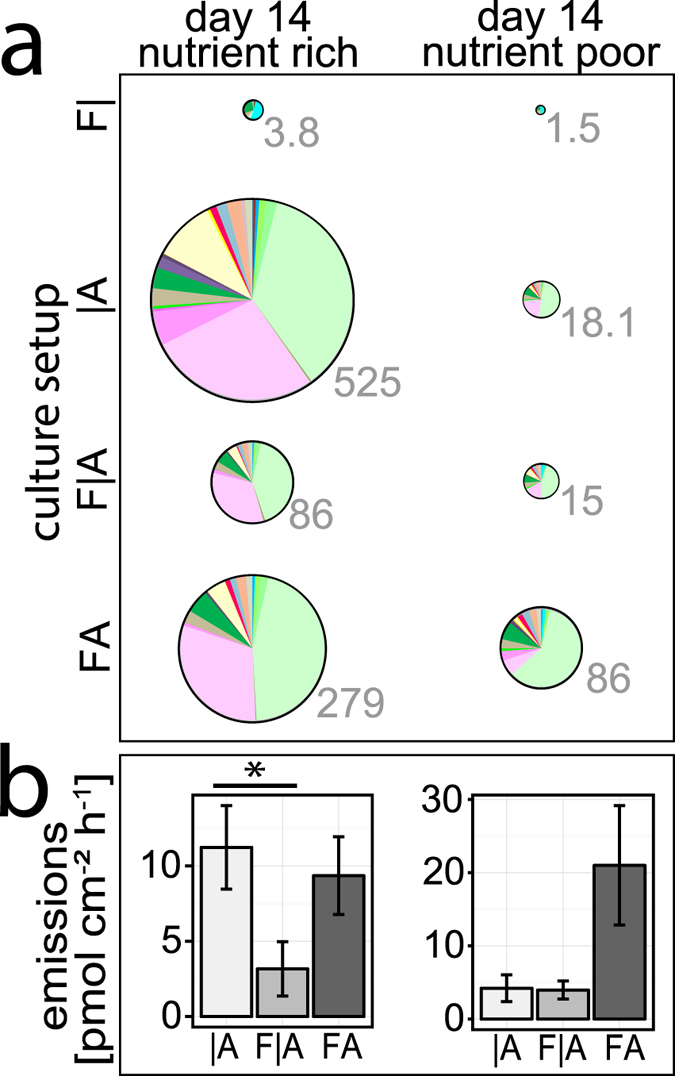
Figure 3. Emission rate after 14 days of cultivation on nutrient rich and poor media.

(a) Total emission rate of VOC under different cultivation conditions; F|: Fusarium oxysporum alone, |A: Alternaria alternata alone, F|A: split-plate with both fungi, FA: direct confrontation of both fungi; pie chart areas are proportional to the emitted volatiles, grey numbers: means (n = 5) of total VOC emission rates (pmol plate−1 h−1); the exact values underlying each pie chart are available in Supplementary Tables S1–S2. Colors are coded as in Fig. 2a. (b) Total emission rate normalized to the projected surface area (pmol cm−2 h−1) of A. alternata on each plate (F|A and FA culturing: ignoring the minute share of F. oxysporum on the total emissions); means ± s.e. (n = 5).
