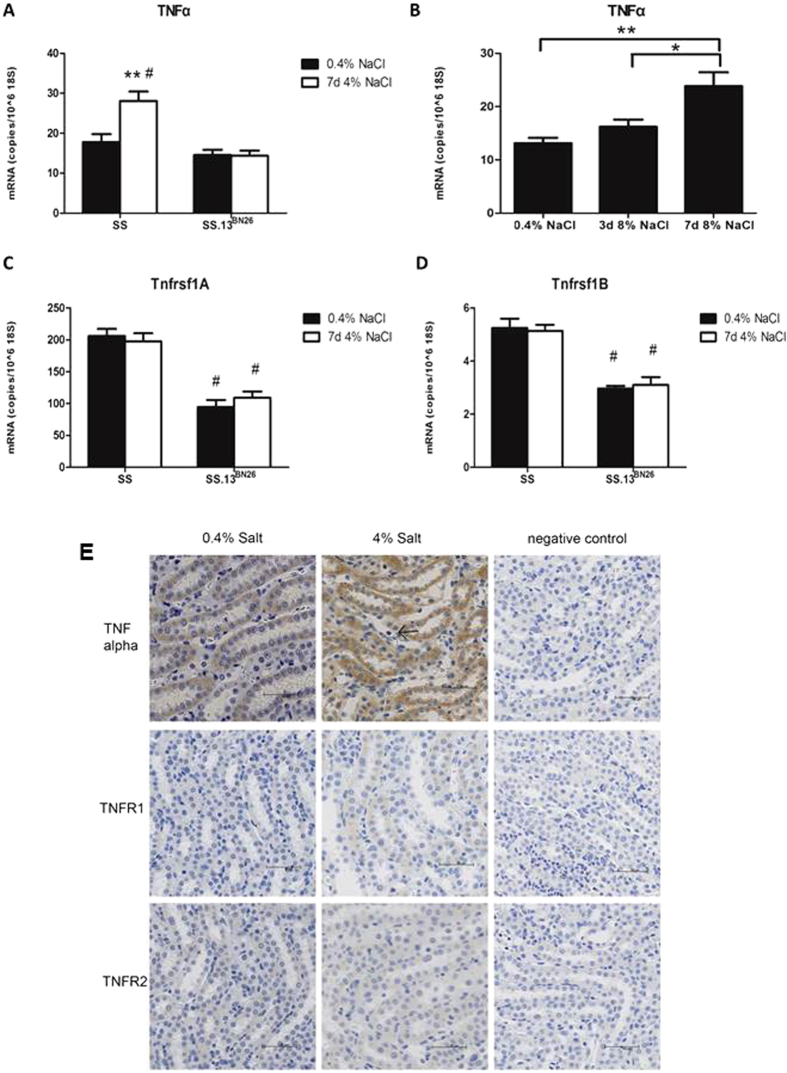
Figure 1. Abundance of TNFα and its receptors Tnfrsf1A and Tnfrsf1B in the renal medulla of SS and SS.13BN26 rats.
(A) TNFα mRNA abundance in SS rats increased significantly when treated with a 4% NaCl diet for 7 days compared with SS rats on a 0.4% NaCl diet (n = 9, **P < 0.01) or salt-insensitive SS.13BN26 rats (#P < 0.01). (B) TNFα abundance in SS rats increased significantly after 8% NaCl diet for 7 days (n = 6, **P < 0.01 vs. 0.4% NaCl diet; *P < 0.05 vs. 3 days of 8% NaCl diet). (C,D) Abundance of TNFα receptors Tnfrsf1A and Tnfrsf1B were significantly higher in SS rats than in SS.13BN26 rats (n = 9, #P < 0.01 vs. SS). (E) Immunohistochemistry analysis. Representative images of renal medulla regions from SS rats maintained on the 0.4% NaCl diet or fed the 4% NaCl diet for 7 days (n = 6–9) are shown. The primary antibody was omitted in negative control. Brown color indicates positive staining. The arrow points to cells that appear to be infiltrating inflammatory cells. Scale bar is 50 μm.

