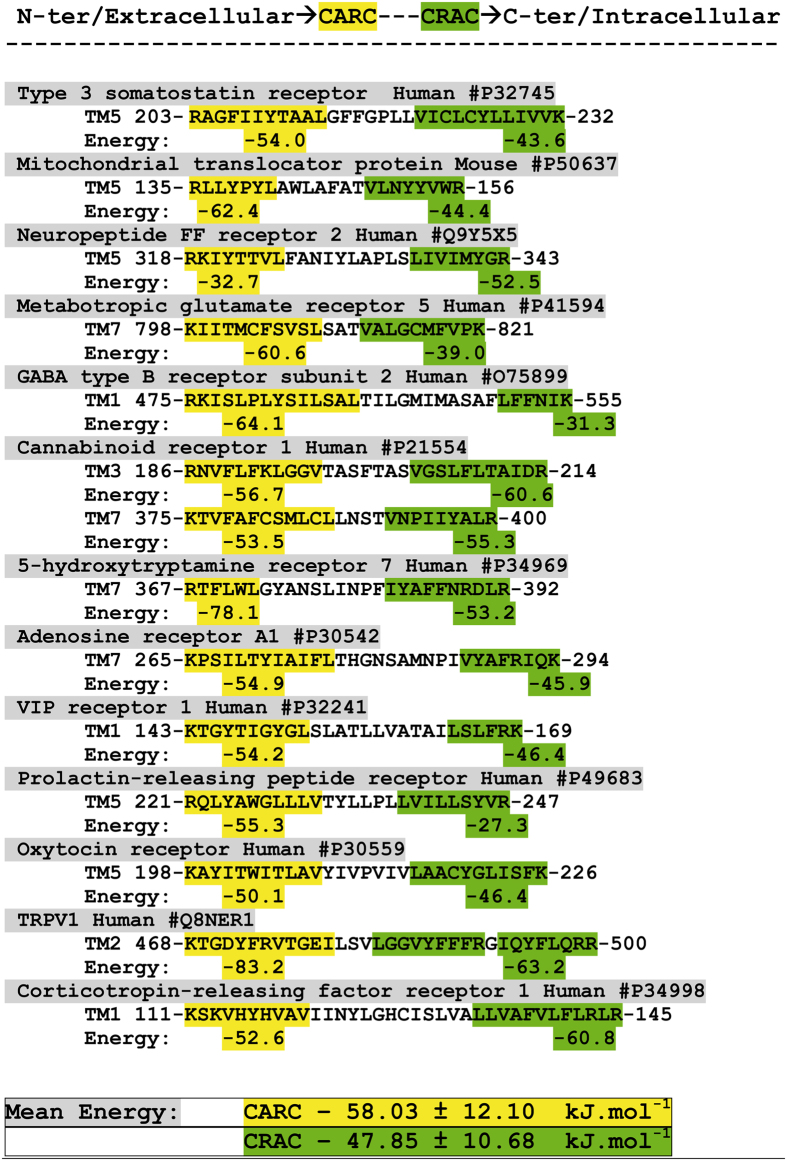
Figure 6. Energetics of cholesterol binding to TM domains displaying both CARC and CRAC motifs.
The CARC motif is framed in yellow, and the CRAC motif in green. The calculated energy of interaction (in kJ.mol−1) is indicated under each motif. The UniProt entry is indicated for each protein after the # symbol.

