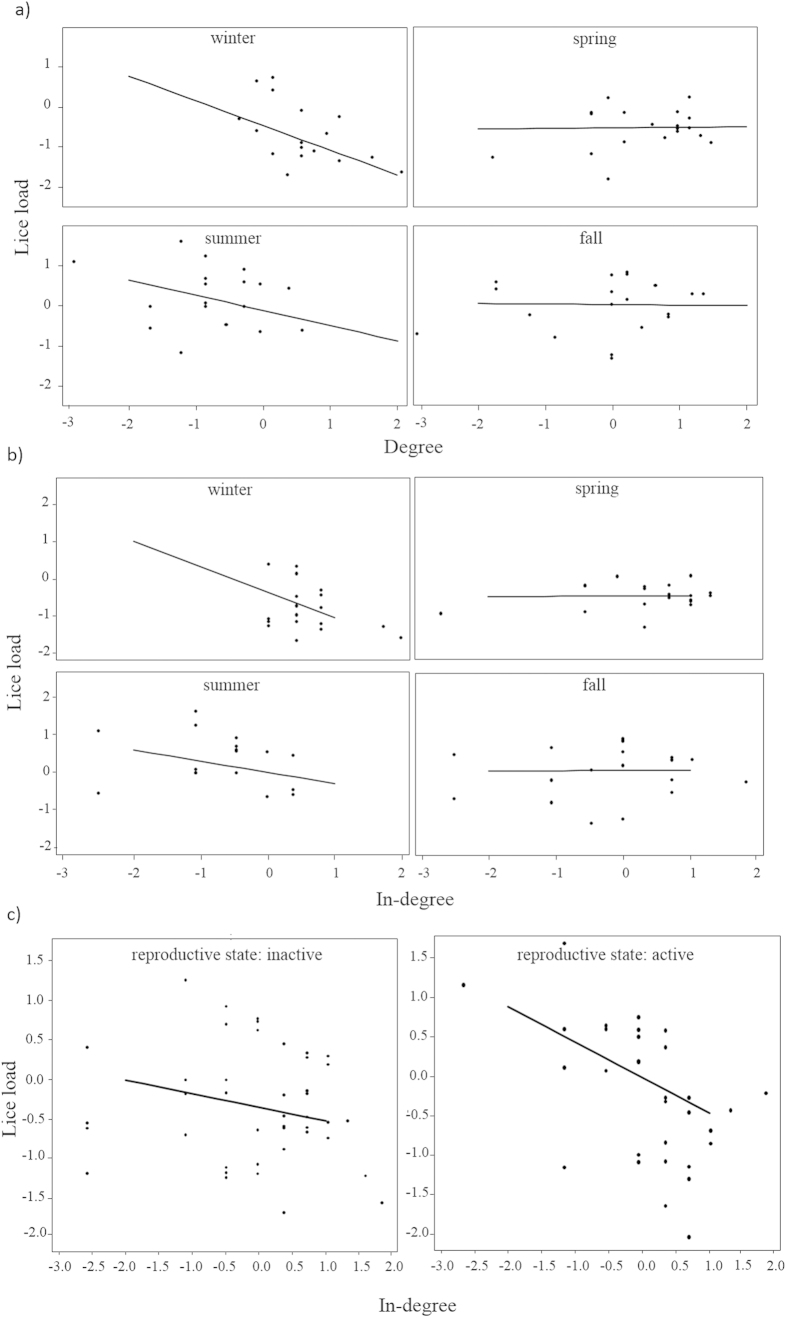
Figure 5. Effects of the interaction between number of connections in the network and seasonality or reproductive state on lice load.
panel (a) shows degree (contact network) and season, panel (b) shows in-degree (grooming received network) and season, panel (c) shows in-degree (grooming received network) and reproductive state. The four seasons (winter, spring, summer, and fall) each have their own square, the two reproductive state (active, not active) as well. The line represents predictions from the model and dots the raw data transformed (i.e. log of the response (lice load) and square-root of the predictor (centrality)) and scaled.

