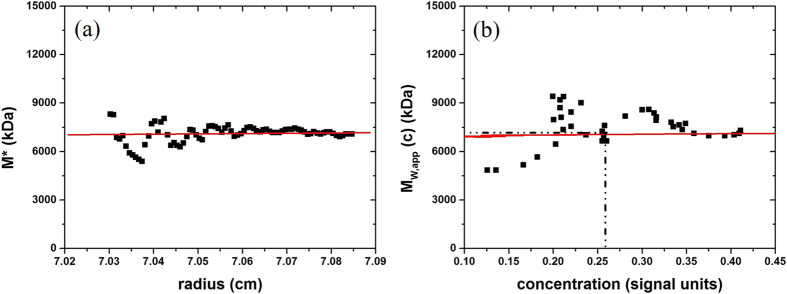
Figure 3. SEDFIT-MSTAR output for analysis of Hib PRP-TT conjugate at a loading concentration of 0.3 mg.mL−1 to find the (apparent) weight average molar mass Mw,app over the whole distribution.
(a) The operational point average molar mass M*(r) plotted as a function of radial position from the centre of rotation r. Mw,app, the (apparent) weight average molar mass for the whole distribution being measured = M* extrapolated to the radial position at the cell base. Retrieved Mw,app from this extrapolation = (7.3 ± 0.4) × 106 g.mol−1. (b) Plot of the “point” or “local” apparent average molar mass Mw,app(r) at radial positions r, as a function of local concentration c(r) in the ultracentrifuge cell. The “hinge point” corresponds to the radial position where the c(r) = the initial loading concentration. At this hinge point Mw,app(r) = (7.3 ± 0.5) × 106 g.mol−1. Although not as precise a way of estimating Mw,app from the sedimentation equilibrium records it does provide an internal check for consistency.

