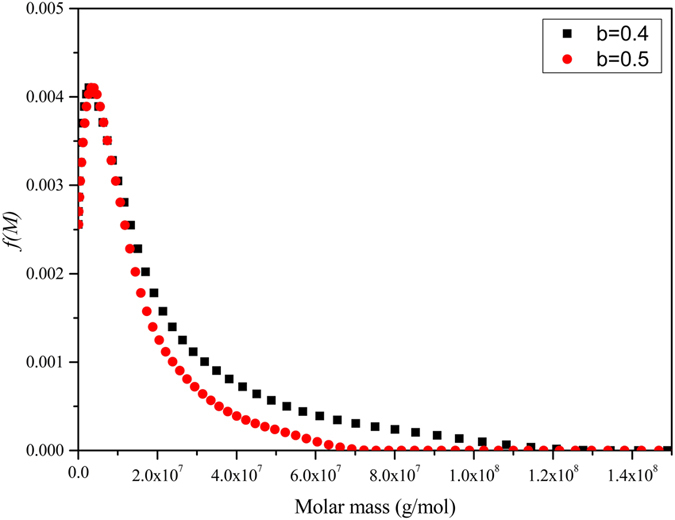
Figure 4. Molar mass distribution f(M) profile from sedimentation velocity for Hib PRP-TT conjugate.

Obtained by transforming the sedimentation coefficient distribution of Fig. 1c by the Extended Fujita method, using the weight average sedimentation coefficient with the weight average Mw,app (from Fig. 3) molar mass and two different plausible values of the conformation parameter b. The broad distribution is completely different for the sharp monomer-dimer distribution we observed earlier for TT by itself 33.
