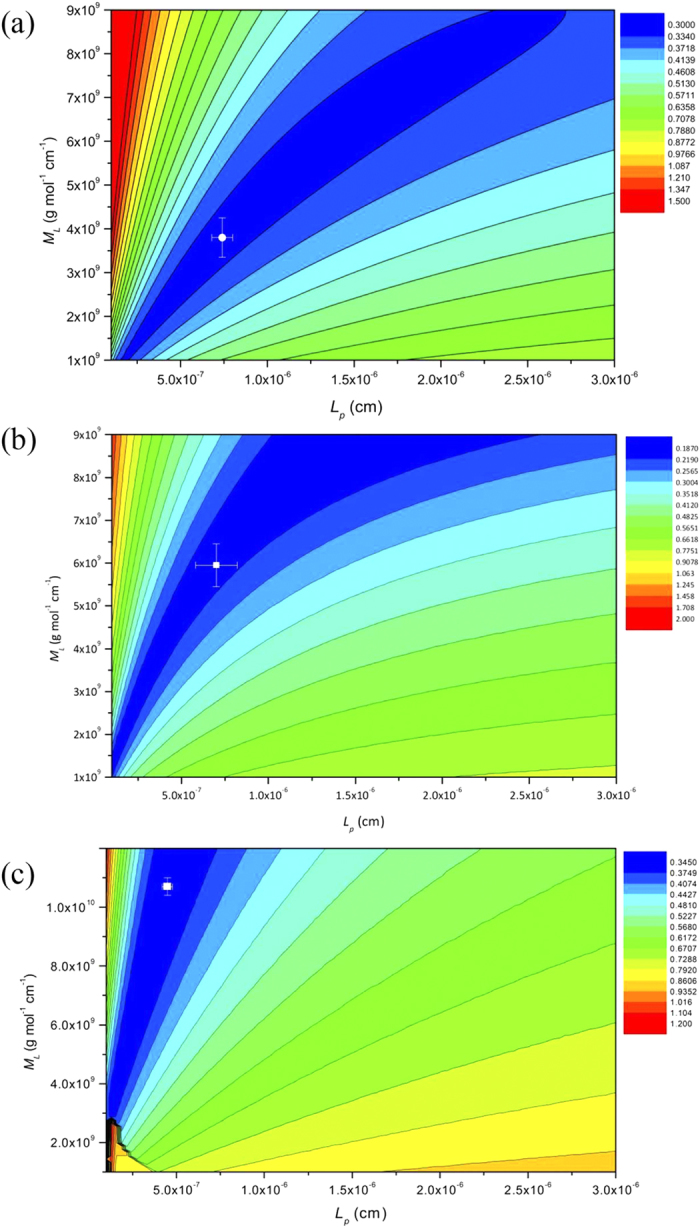
Figure 5. Plot of mass per unit length ML versus persistence length Lp evaluation using the multi-HYDFIT procedure of Ortega and Garcia de la Torre41.

(a) the Hib PRP-native polysaccharide. The plot yields Lp ∼ 7.0 × 10⁻⁷ (cm) and ML ∼ 3.8 × 10⁹ (g.mol−1.cm−1) at the minimum target (error) function (indicated by the white cross). (b) Hib PRP-ADH, Lp ∼ 7.0 × 10⁻⁷ (cm) and ML ∼ 6.0 × 10⁹ (g. mol−1. cm−1); (c) Hib PRP-TT Lp ∼ 4.5 × 10⁻⁷ (cm) and ML ∼ 10.7 × 10⁹ (g. mol−1. cm−1).
