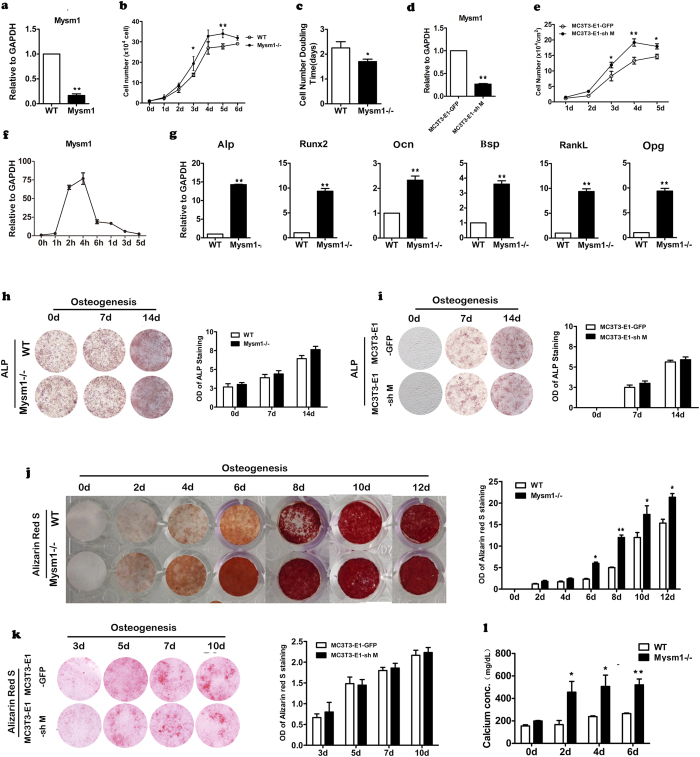
Figure 3. Effect of Mysm1 deficiency on preosteoblast proliferation and osteogenesis.
(a) qRT-PCR to measure mRNA levels within preosteoblasts from Mysm1−/− mice and WT mice, n = 5. (b) The cell proliferation curve of primary preosteoblasts from calvaria tissues, n = 4. (c) Graph showing the doubling time of primary preosteoblasts, n = 5. (d) qRT-PCR to measure mRNA levels of Mysm1 in MC3T3-E1 cell lines post transduction with LV-GFP (MC3T3-E1-GFP) or LV-shMysm1 (MC3T3-E1-shM), n = 5. (e) The cell proliferation curve of MC3T3-E1-GFP and MC3T3-E1-shM. (f) qRT-PCR to measure mRNA levels of Mysm1 in preosteoblast from WT mice, cultured in osteogenic medium, n = 5. (g) qRT-PCR to measure mRNA expression of Alp, Runx2, Ocn, Bsp, RankL and Opg. (h) Alkaline phosphatase staining (left) and the OD value (right) of Mysm1−/− mice and WT littermate MSCs at different time points during in vitro osteogenesis. n = 4. (i) Alkaline phosphatase staining (left) and the OD value (right) of MC3T3-E1-GFP and MC3T3-E1-shM cells at different time points during in vitro osteogenesis. n = 4. (j) Alizarin red S staining (left) and the OD value (right) of Mysm1−/− mice and WT littermate MSCs at different time points (0–12 days) during in vitro osteogenesis. n = 4. (k) Alizarin red S staining (left) and the OD value (right) of MC3T3-E1-GFP and MC3T3-E1-shM cells at different time points during in vitro osteogenesis. n = 4. (l) Calcium amount in MSCs at different time points (0, 2, 4, and 6 days) during in vitro osteogenesis, n = 5. Error bar is ± SEM; *p < 0.05; **p < 0.01.

