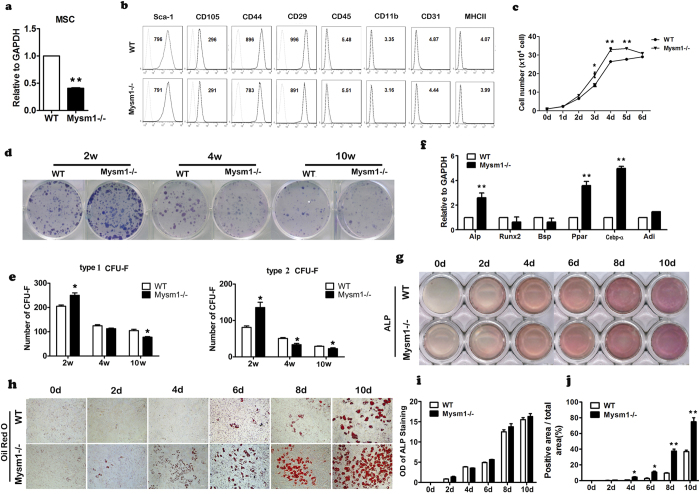
Figure 4. Mysm1−/− mice showed increased autonomous differentiation.
(a) qRT-PCR to measure mRNA levels of Mysm1 in MSCs, n = 5. (b) Flow cytometry analysis of MSCs from Mysm1−/− and WT mice. (c) The cell proliferation curve of MSCs from tibia and femur tissues, showing that Mysm1−/− MSCs have a higher proliferation rate, n = 4. (d) Colony-forming unit (CFU) assays showing total colonies formed by Mysm1−/− and WT bone marrow stromal cells. Colonies were stained with Giemsa. (e) Statistical analyses of CFU assays. The number of colonies (each containing a minimum of 50 cells for type 1 and 100 cells for type 2) was calculated after the total number of Mysm1−/− colonies was set to 100%, n = 3. (f) qRT-PCR to measure mRNA levels of Alp, Runx2, BSP, Ppar-γ, Cebp-α and Adi of MSCs cultured to confluence for 5 days. (g) Alkaline phosphatase (ALP) staining of WT and Mysm1−/− MSCs at different time points during in vitro culture in α-MEM containing 10% FBS. (h) Oil-Red-O staining of WT and Mysm1−/− MSCs at different time points during in vitro culture in α-MEM containing 10% FBS. (i) OD value of ALP staining of WT and Mysm1−/− MSCs at different time points during in vitro culture in α-MEM containing 10% FBS, n = 4. (j) The percentage of Oil-Red-O positive area to the total area (%) of MSCs, at different time points during in vitro culture in α-MEM containing 10% FBS, n = 4. Error bar is ± SEM; *p < 0.05; **p < 0.01.

