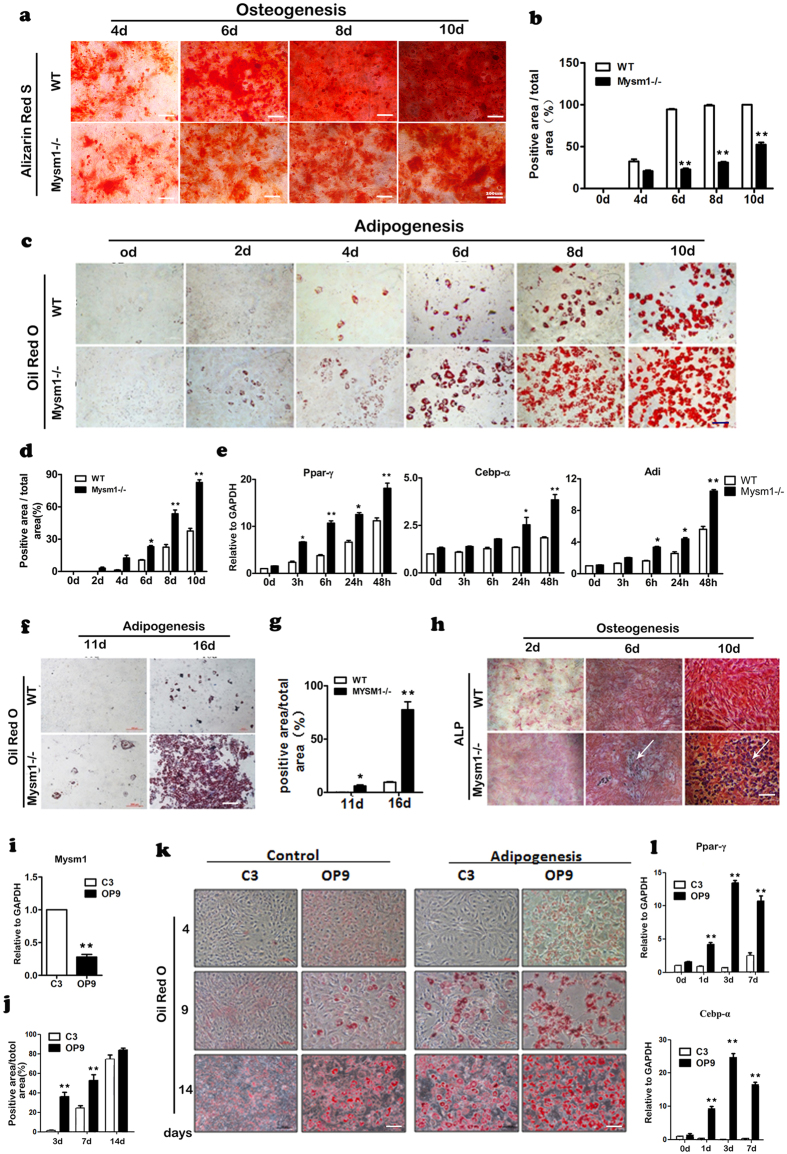
Figure 5. Mysm1−/− MSCs show enhanced adipocyte differentiation.
(a) Alizarin red staining of WT and Mysm1−/− MSCs at different time points during in vitro osteogenesis. Scale bar, 200 μm. (b) Percentage of Alizarin red positive staining area to the total area (%), n = 4. (c) Oil-Red-O staining of WT and Mysm1−/− MSCs at different time points during in vitro adipogenesis, Scale bar, 200 μm. (d) The percentage of Oil-Red-O positive area to the total area (%), n = 4. (e) qRT- PCR to measure mRNA levels of Ppar-γ, Cebp-α, and Adi in Mysm1−/− and WT MSCs at different time points during in vitro adipogenesis, n = 5. (f) Oil-Red-O staining of preosteoblasts from WT and Mysm1−/− mice from calvaria tissues at 11 and 16 days during in vitro adipogenesis, Scale bar, 200 μm. (g) The percentage of Oil-Red-O positive area to the total area (%), n = 4. (h) ALP staining of WT and Mysm1−/− preosteoblasts from calvaria tissues at days 2, 6, and 10 during in vitro osteogenesis, scale bar, 200 μm. (i) qRT-PCR to measure mRNA levels of Mysm1 in the C3H/10T1/2 and OP9 cell lines, n = 5. (j,k) Percentage of Oil-Red-O positive area to the total area (%) and Oil-Red-O staining of the cell lines at different time points during in vitro adipogenesis. (l) qRT-PCR to measure mRNA levels of Ppar-γ and Cebp-α in the C3H/10T1/2 and OP9 cell lines at different time points during in vitro osteogenesis, n = 5. Error bar is ± SEM; *p < 0.05; **p < 0.01.

