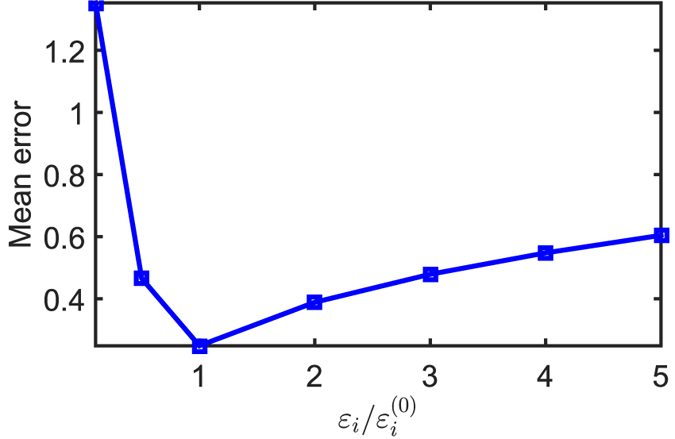
Figure 3. Variation of inference error with total perturbation bound εi.

The inference error attains a minimum near the true bound  , and it trends almost linearly with
  as it is increased beyond
  . As
. As  , the inference error increases exponentially, which is an evidence of over fitting.
