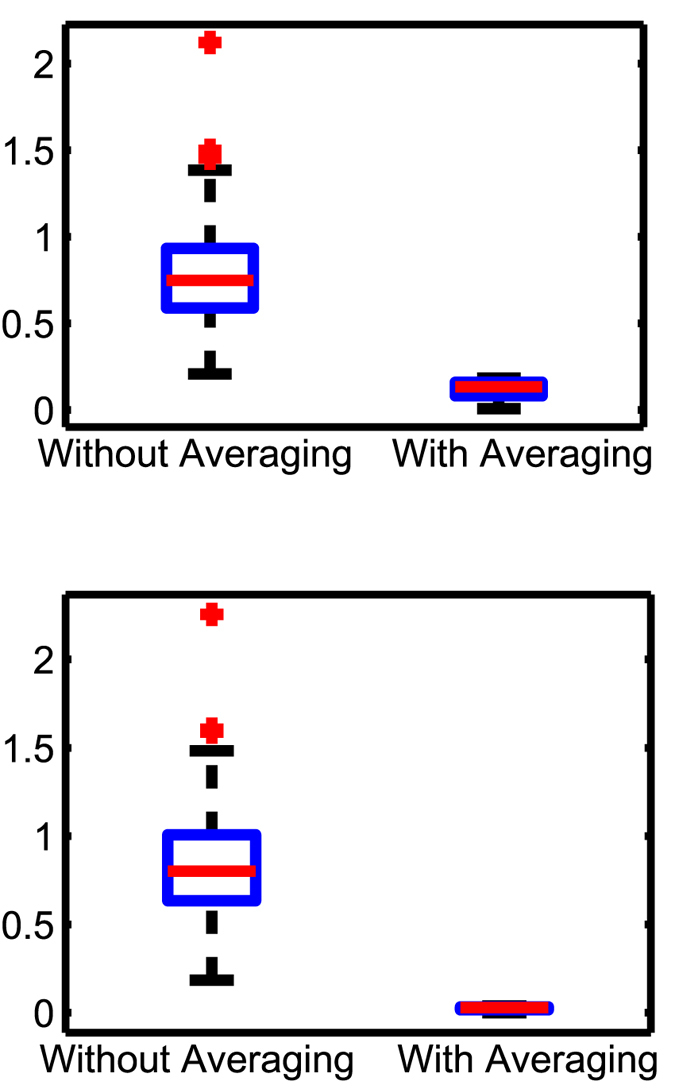
Figure 4.

Box plots summarizing the effects of averaging on (a) ND and (b)  -min with
  . The inference errors were almost unchanged with
  -min compared to ND. Averaging (light/red) reduced inference error further by about 8 times compared to without averaging (dark/blue). The
  values were 0.1196 with ND and 0.0259 with
  -min (p-values of the paired t-tests between the inference error without and with averaging were ≤10−5 in all cases).
