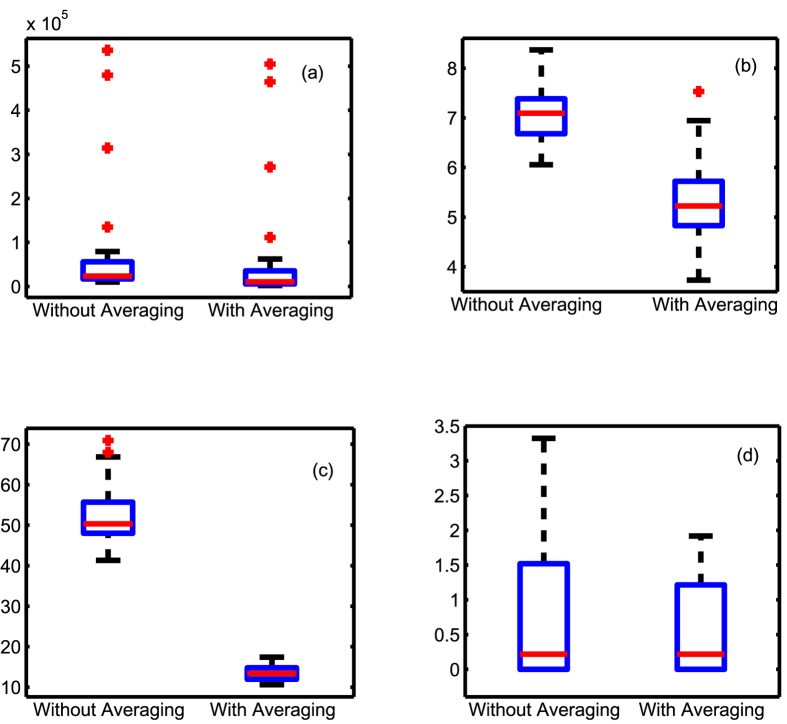
Figure 5. Box plots summarizing the inference errors without and with averaging for.
(a) Sontag et al.’s33 method  ; (b)
; (b)  -min with noise magnitude given
  , (c)
, (c)  -min with noise magnitude underestimated as 10% the actual
  , and (d)
  -min with noise magnitude overestimated as 10 times the actual
  . The inference error was reduced by 105 times when using the
  -min approach (21, 22), compared to Sontag et al.’s33 method. Averaging further reduced inference error by at least 30% in all cases (p-values of the paired t-tests consistently were below 0.0282).

