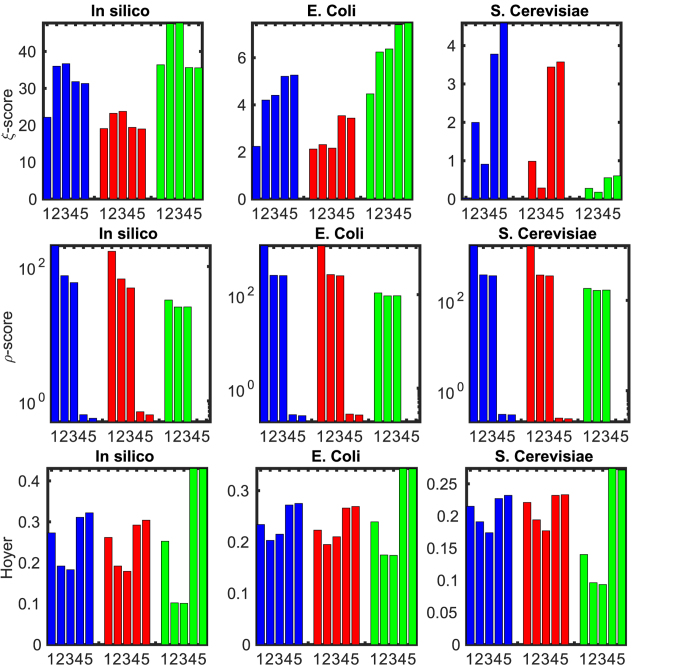
Figure 6. Performance comparison of (1) original G matrix, (2) ND, (3) ND with averaging, (4) ℓ1-min and (5) ℓ1-min with averaging for the DREAM5 challenge datasets.
The total influence G matrix is estimated by Pearson correlation (blue/dark), Spearman correlation (red/light) and Mutual Information (green/light). Compared to ND, the prediction scores with  -min are increased by 23.94% (for G from Pearson correlation), 53.03% (for G from Spearman correlation) & 18.53% (for G from Mutual Information) for E. Coli, 89.09%, 249.7% & 116.74% for S. cerevisiae, respectively; the inference errors ρ (29) are reduced by 2 to 3 orders of magnitude in all cases; Hoyer measures are increased by 34%, 36.41% & 322.91% for E. Coli, 18.85%, 19.59% & 96.65% for S. cerevisiae, respectively. For in silico data, ND gives a solution with 11% higher prediction score but 33% less sparse than
  -min approach. Averaging slightly improves the performance of all methods (<10%).

