Figure 8. Cell morphology after CAP treatment.

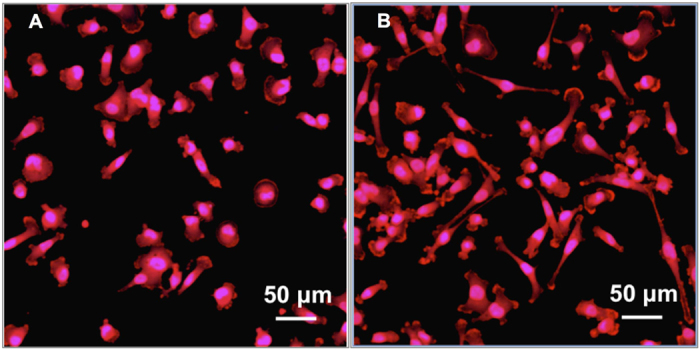
Confocal images of MDA-MB-231 cells with (A) CAP exposure compared to (B) untreated control. Cells were fixed and stained after 60 s CAP exposure and incubated 1 h.

Confocal images of MDA-MB-231 cells with (A) CAP exposure compared to (B) untreated control. Cells were fixed and stained after 60 s CAP exposure and incubated 1 h.