
Figure 2.
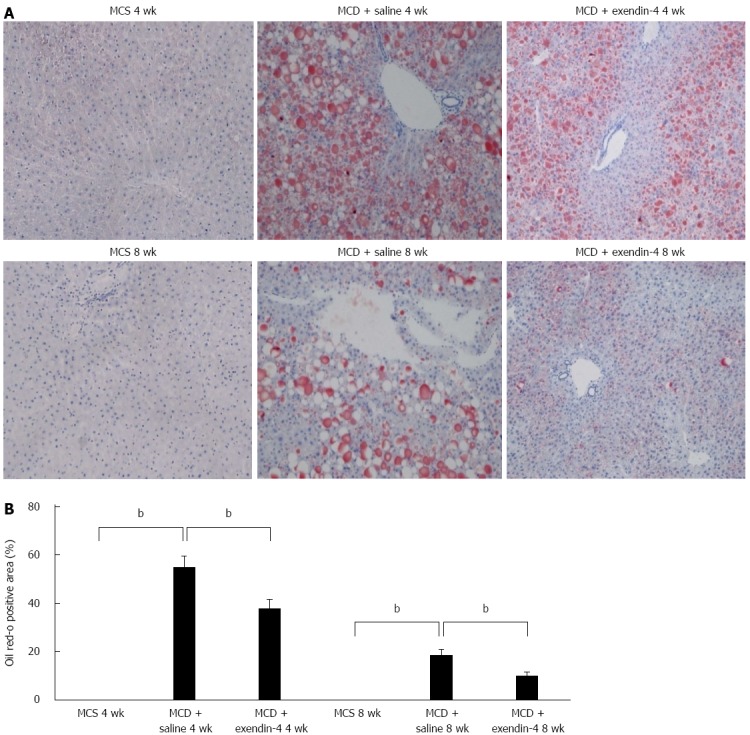
Evaluation of hepatic lipid contents of mice fed mice fed methionine-choline-sufficient diet, methionine-choline-deficient diet with exendin-4 or saline for 4 and 8 wk (A) and quantitative analysis of changes in Oil Red O positive area in respective groups (B). Frozen liver sections were stained with Oil Red O. Data are expressed as mean ± SE. (bP < 0.01 vs respective groups). Original magnification, 100 ×. MCD: Methionine-choline-deficient diet; MCS: Mice fed methionine-choline-sufficient diet.