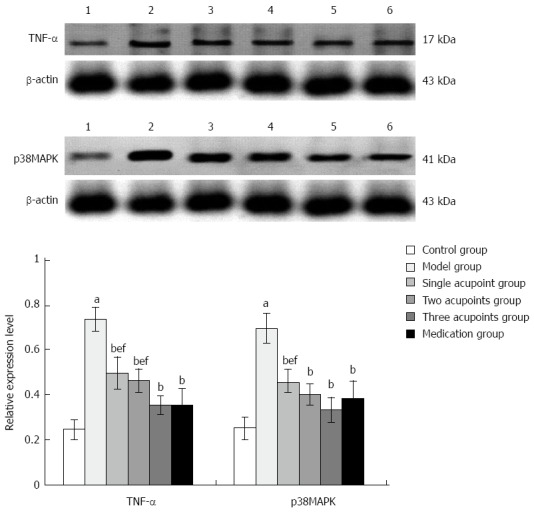
Figure 4.

Comparison of tumor necrosis factor-α and p38 mitogen-activated protein kinase expression in colonic tissue. Representative Western blot and quantification showing that the expression of TNF-α and p38MAPK protein are decreased significantly after the different treatments. Data are expressed as mean ± SD; n =6/group. aP < 0.01 vs control group; bP < 0.01 vs model group; eP < 0.01 vs three acupoints group; fP < 0.01 vs medication group. Lane 1: control group, 2: model group, 3: single acupoint group, 4: two acupoints group, 5: three acupoints group, 6: medication group. TNF-α: Tumor necrosis factor-α; p38MAPK: p38 mitogen-activated protein kinase.
