
Figure 138.
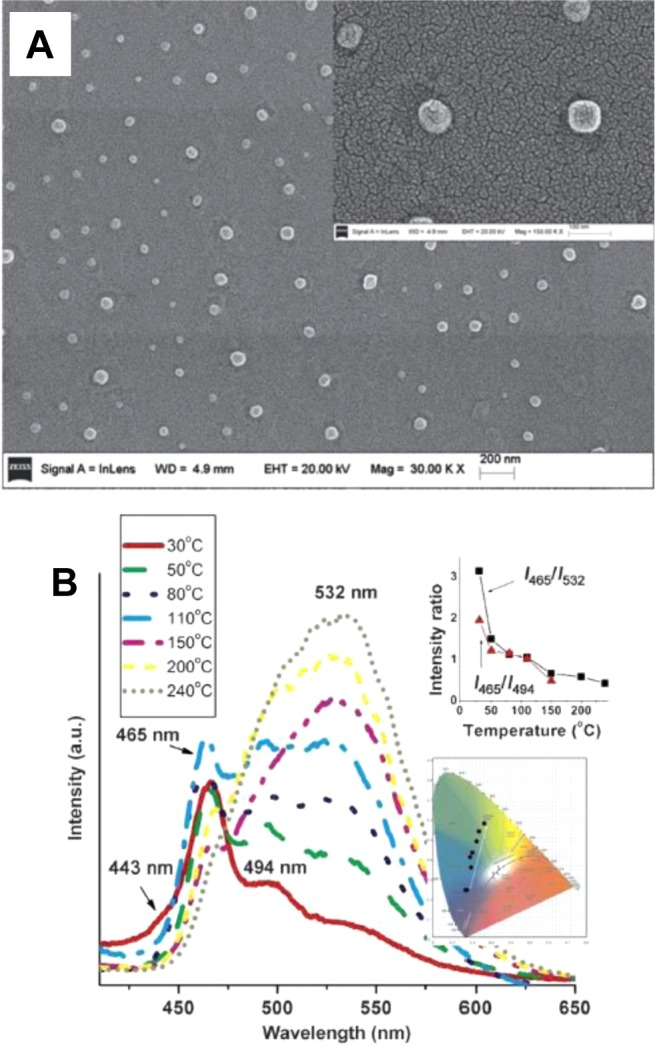
(A) Scanning electron micrograph of the 12:A nanococrystals. (B) Fluorescence spectra of the nanococrystals at different temperatures. The inset shows the fluorescenece intensity ratios at I465nm/I532nm and the dependence of the color coordinates on the temperature. Reprinted with permission from ref (1003). Copyright 2013 Wiley-VCH.