
Figure 29.
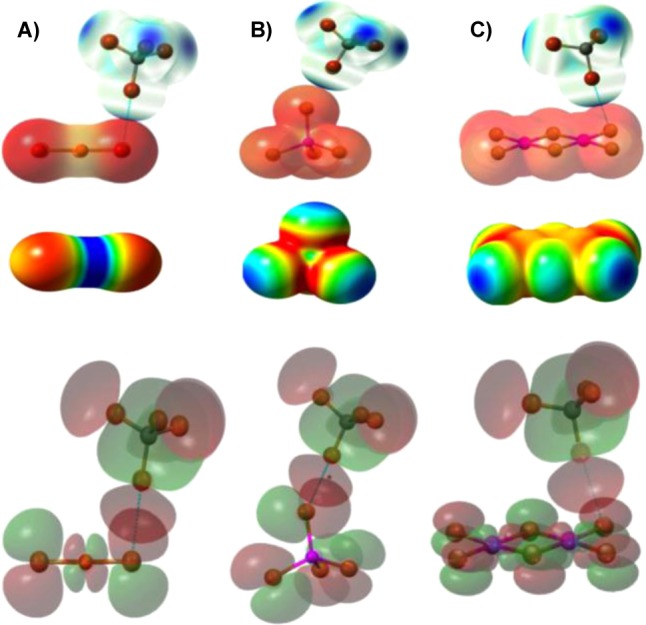
(Top) VS(r) (calculated at the B3LYP/6-311+G(dp) level on the 0.001 electron/bohr3 molecular surfaces) of the XB donors and acceptors superimposed onto X-ray structures of their complexes: (A) CBr4/[CuBr2]−; (B) CBr4/[ZnBr4]2–; (C) CBr4/[Pt2Br6]2–. Blue and red colors depict positive and negative potentials, respectively. (Middle) The electrostatic potentials of bromometalate anions are negative everywhere, but noticeable variations of their values are also observed and depicted with a color gradient from the most negative (red) to the least negative (blue) values (kcal/mol): (A) [CuBr2]−, from −100 (red) to −80 (blue); (B) [ZnBr4]2–, from −170 (red) to −150 (blue); (C) [Pt2Br6]2–, from −155 (red) to −125 (blue). (Bottom) MO shapes (B3LYP/6-311+G(dp) level) of CBr4 and halometalates, superimposed onto crystal structures of their complexes. HOMOs of bromometalates are mostly located on the bromide ligands. Adapted from ref (218). Copyright 2012 American Chemical Society.