
Figure 32.
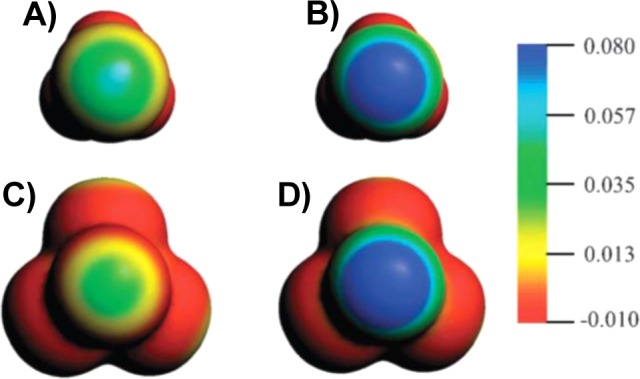
Molecular electrostatic potential at the isodensity surface of CF3–I (A) and CI4 (C) at the same contour value of 0.001 electron/bohr3. The red color shows the most negative potential, while the blue color represents the most positive one. The σ-holes of CF3–I (B) and CI4 (D) in the presence of a 1.0 point charge are also depicted. Energies are expressed in atomic units. Reprinted with permission from ref (217). Copyright 2012 Royal Society of Chemistry.