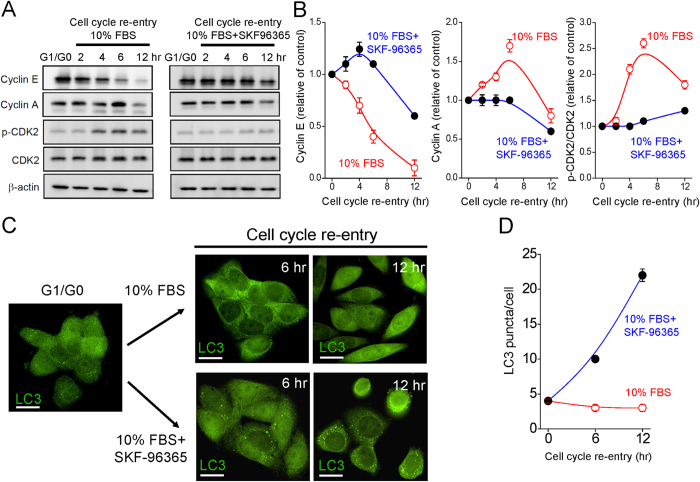
Figure 7. Blockade of SOCE activation leads to cell autophagy.
(A) Western blot analysis of expression pattern of cell cycle-associated proteins, including cyclin E, cyclin A, CDK2 and phosphorylated CDK2 (p-CDK2). Cell lysates were collected from cervical cancer SiHa cells at indicated time points of cell cycle re-entry. (B) Densitometric quantitative analyses of cyclin E, cyclin A and p-CDK2/CDK2 level during cell cycle progression. Expression levels of cyclin E, cyclin A, CDK2 and pCDK2 were normalized against β-actin and compared with the control group (G1/G0 phase). Each point represents mean ± SEM of three different experiments. (C) SKF-96365 (50 μM) induces the formation of LC3 puncta at 6, 12 hrs of cell cycle re-entry. Representative images showing the expression of LC3 (green). Scale bars: 10 μm. (D) Quantitative analyses of cellular LC3 puncta. Each value represents mean ± SEM from at least 30 different cells.

