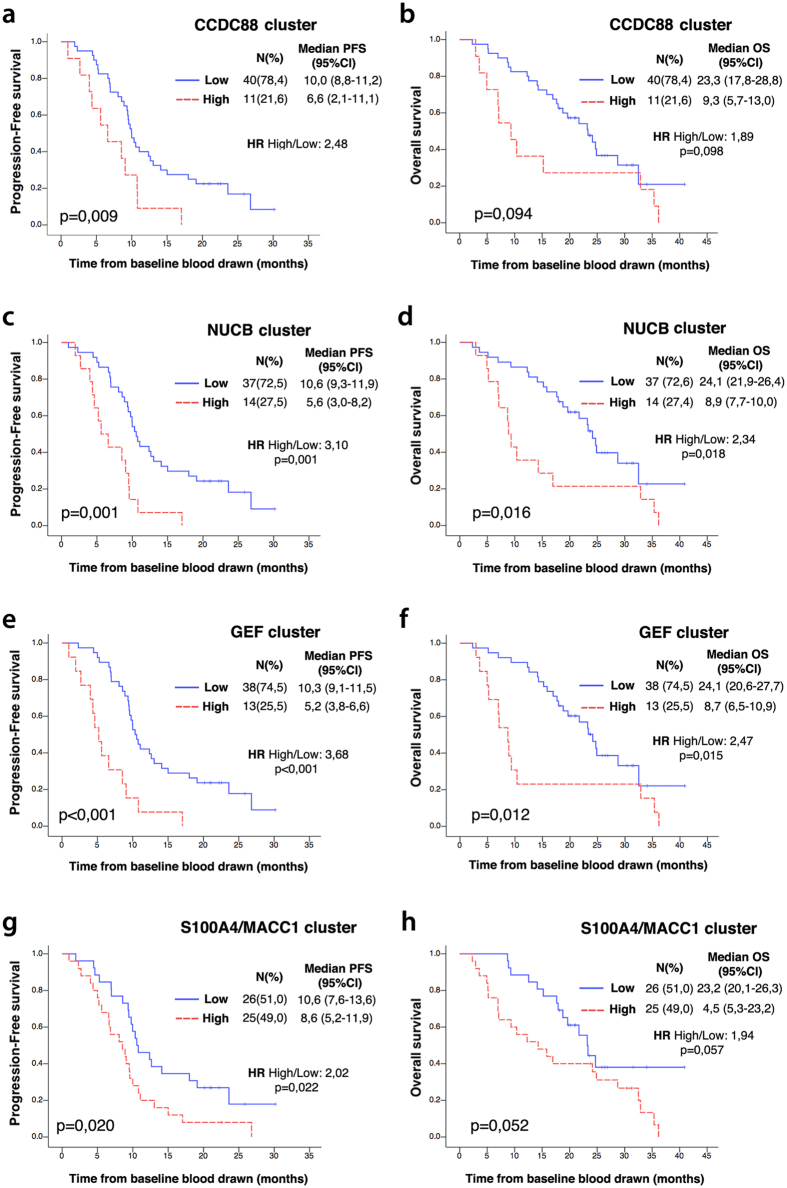
Figure 4. Association of progression-free (PFS) and overall (OS) survival with gene cluster expression level.
Kaplan-Meier plots for PFS (left) and OS (right) are shown for dichotomized expression levels of CCDC88 cluster (CCDC88A and CCDC88C) (a,b), NUCB cluster (NUCB1 and NUCB2) (c,d), all GEF cluster (CCDC88A, CCDC88C, NUCB1 and NUCB2) (e,f), and the positive control, S100/MACC1 cluster (g,h). Red, expression above the 75th percentile; Blue, expression below this level (see text for details). N = number of patients in each group. H.R = Hazard ratio. Median PFS and OS are expressed in months. CI: Confidence interval.

