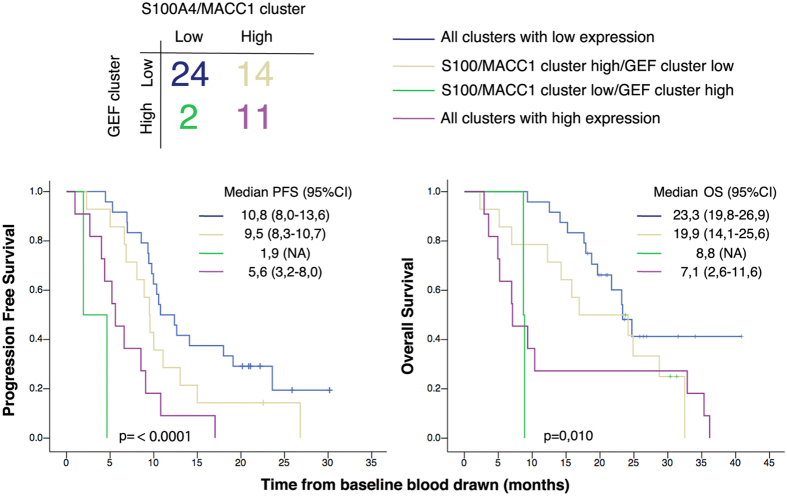
Figure 5. Stratification by GEF cluster expression level further improves the prognostic power of MACC1/S100A4.
Top: Patients were classified into four groups, by expression levels of the GEF cluster or S100A4/MACC1 cluster. Bottom: Kaplan-Meier plots of PFS and OS for each group. Median PFS and OS are expressed in months. CI: Confidence Interval. Pair wise comparison of groups 1 through 4 against each other for progression free and overall survival is tabulated in Table S3.

