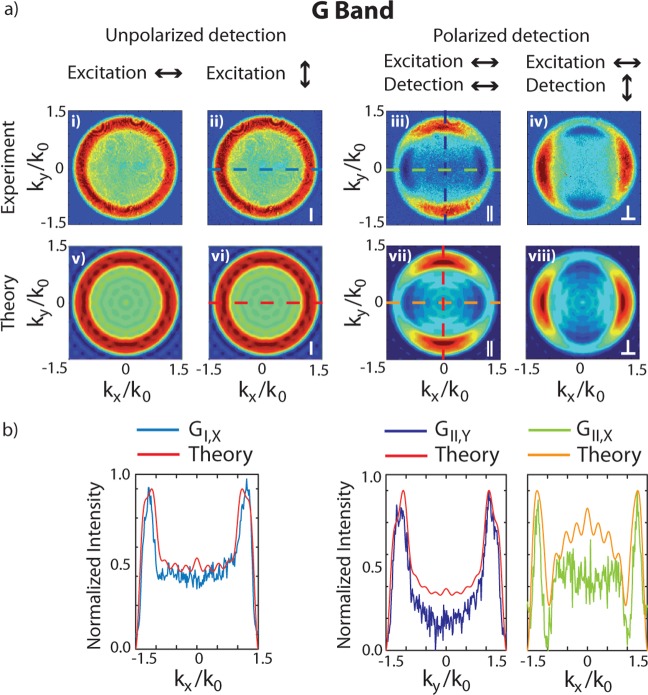
Figure 1.
(a) Experimental and calculated G peak BFP images with and without analyzer. The same scaling is used in each row for the experimental and theoretical data. (b) Cross sections taken through the center of the experimental and calculated BFP patterns in (a). The arrows indicate the direction of polarization.

