Figure 2.

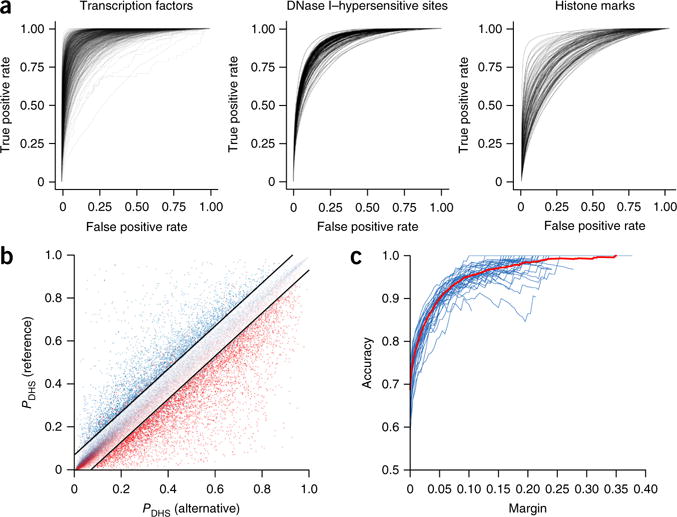
The deep-learning model accurately predicts chromatin features from sequence with single-nucleotide sensitivity. (a) Receiver operating characteristic (ROC) curves for each TF (left), DNase-seq (center) and histone-mark (right) profile prediction. Chromatin features with at least 50 test-positive samples were used. (b) DeepSEA predictions for DNase I–sensitive alleles of 57,407 allelically imbalanced variants from the digital genomic footprinting (DGF) DNase-seq data for 35 different cell types. The y and x axes show, respectively, for a variant, the predicted probabilities that the sequences carrying the reference allele and the alternative allele are DHSs within the corresponding cell type. The red and blue dots represent, respectively, the experimentally determined alternative allele–biased and reference allele–biased variants as determined by DGF data. The black lines indicate the margin, or the threshold of predicted probability differences between the two alleles for classifying high-confidence predictions (margin = 0.07 for this plot). (c) Accuracy. Each blue line indicates the performance for a different cell type, and the red line shows the overall performance on allelically imbalanced variants for all 35 cell types.
