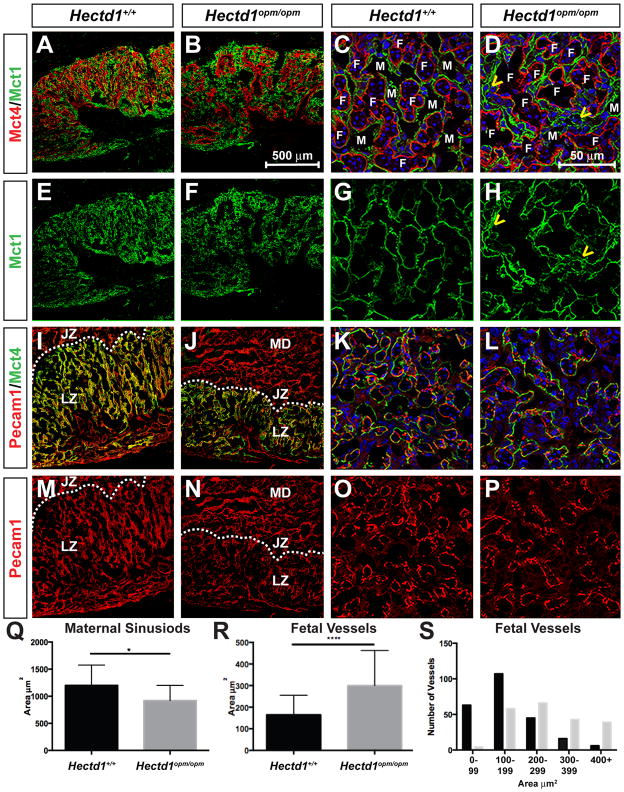
Figure 6. Altered organization of SynT-I, SynT-II and fetal blood vessels in the Hectd1 mutant placenta.
Expression of Mct1 (SynT-I cells, green) and Mct4 (SynT-II cells, red) were examined by immunofluorescence confocal microscopy in E12.5 wildtype (A, C, E, G) and mutant (B, F, D, H) placentas. Expression of Mct4 (SynT-II cells, green) and Pecam1 (endothelial cells, red) in E12.5 wildtype (I, K, M, O) and mutant (J, L, N, P) placentas. Nuclei are stained with Hoechst and shown in Blue in panels C, D, K and L. Placentas in panels A, B, E, F, I, J, M and N are sectioned in the transverse plane and shown at 10X and C, D, G, H, K, L, O and P in the coronal plane and shown at 60X. Yellow arrowheads in D and H highlight abnormal organization of SynT-I cells in the mutant. Fetal (F) and maternal (M) blood spaces are labeled. In panels I, J, M, N, the layers of the placenta are labeled as maternal decidua (MD), junctional zone (JZ) and labyrinthine zone. The dotted line denotes the boundary between junctional and labyrinthine zones. Q–S) The area of maternal (Q) and fetal (R, S) blood spaces were measured and the average area plotted (Q, R). 208 maternal blood spaces were measured in 13 wildtype and 155 blood spaces were measured in mutant sections from 4 wildtype and 2 mutant placentas. 237 fetal vessels in 12 wildtype and 210 fetal vessels in 18 mutant sections were measured from 4 wildtype and 2 mutant placentas. Significant differences were assessed by paired t-test between mutant and wildtype (* indicates p < 0.05 and *** p < 0.001). (S) The number of fetal vessels with the indicated area for wildtype (black bars) and Hectd1 mutant (grey bars).

