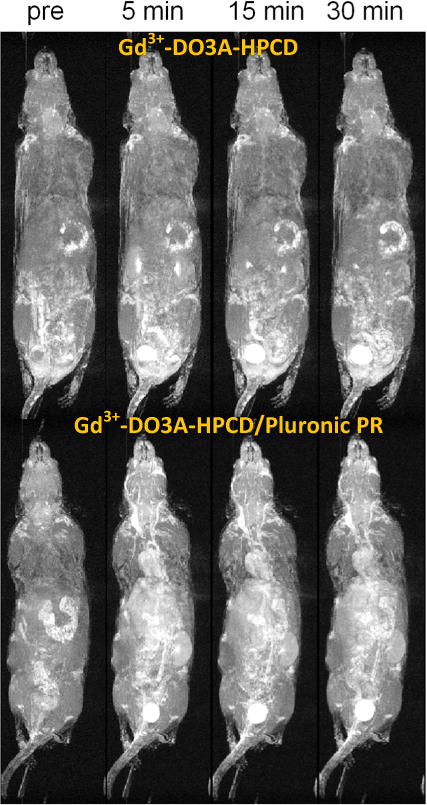
Figure 3.

Representative 3D maximum intensity projection images (T1-weighted) of Balb/c mice injected with Gd3+-DOTA-HPCD (top row) or Gd3+-DOTA-HPCD/Pluronic PR (bottom row) at a 0.03 mM-Gd/kg dose. Images are shown for contrast agent distribution before injection (pre) and at 5, 15 and 30 min after tail vein injection of Gd3+ complexes.
