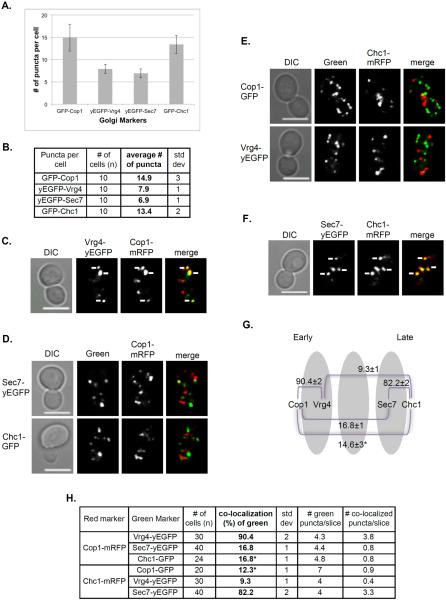
Figure 1. Co-localization pattern of early and late Golgi markers.
Four Golgi markers were tagged with GFP or RFP at their C-termini at their endogenous loci and visualized using live-cell confocal microscopy. A. Bar graph showing the number of GFP-tagged Golgi markers per cell. There are more puncta of vesicle subunit proteins (14–15) than Golgi membrane proteins (7-8) even though they are tagged with GFP and yEGFP, respectively. B. Table showing quantification from two independent experiments used for panel A. C–H: Co-localization of marker pairs was determined as follows: C. Early Golgi markers Cop1-mRFP with Vrg4-yEGFP; D. Early Golgi marker Cop1-mRFP with late Golgi markers Sec7-yEGFP or Chc1-GFP; E. Late Golgi marker Chc1-mRFP with early Golgi markers Vrg4-yEGFP and Cop1-GFP; and F. Late Golgi markers Sec7-yEGFP and Chc1-mRFP. C–F, Shown from left to right: DIC, GFP, RFP, merge (yellow). White arrows point to co-localized signal. Bar, 5 μm. G. Diagram showing the relative distribution of Golgi markers used here. Whereas the ~90% of the two early markers and ~80% of the late markers co-localize with each other, early and late markers exhibit only 10-15% co-localization. H. Table showing quantification from two independent experiments for panels C–F, bolded numbers were used for the diagram in panel G (asterisk in G is an average of values marked by asterisks in H. Error bars and +/− represent STDEV.

