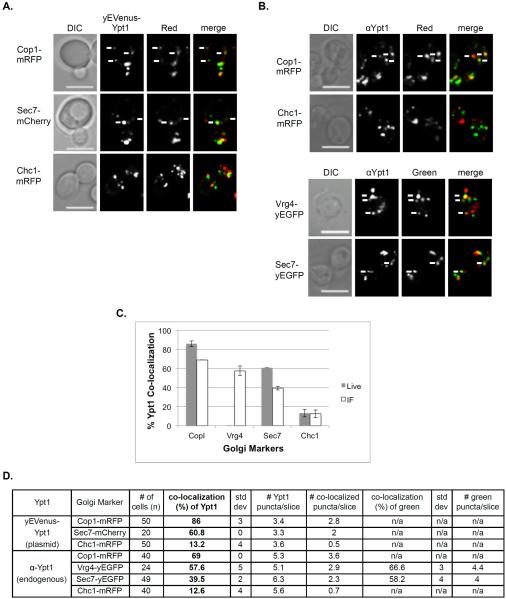
Figure 2. Polarized distribution of Ypt1 from early to late Golgi.
A. Co-localization of Ypt1 using live cell microscopy. Cells expressing a Golgi marker tagged with red fluorescence were transformed with a CEN plasmid for expression of yEVenus-Ypt1. Co-localization was determined using live-cell confocal microscopy. The Golgi markers shown from top to bottom: Cop1-mRFP, Sec7-mCherry and Chc1-mRFP. Shown from left to right: DIC, Ypt1 (green), Golgi marker (red) and merge (yellow). B. Co-localization of Ypt1 using IF microscopy. Cells expressing fluorescently tagged Golgi markers were processed for IF analysis using anti-Ypt1 antibodies. The secondary antibody was conjugated with green (FITC) or red (Texas Red) fluorescent dye depending on the tag of the Golgi marker. Co-localization was determined using confocal microscopy. Shown from left to right: DIC, Ypt1, Golgi marker and merge (yellow). Top panels: Red Golgi markers Cop1-mRFP and Chc1-mRFP. Bottom panels: Green Golgi markers Vrg4-yEGFP and Sec7-yEGFP. For panels A–B: White arrows point to co-localized signals; Bar, 5 μm. C. Bar graph summarizing the quantification of Ypt1 co-localization with the different Golgi markers using live-cell (panel A, grey bars) and IF (panel B, white bars) microscopy. Left to right: Ypt1 co-localize with decreasing frequencies with Cop1, Vrg4, Sec7 and Chc1. D. Table shows quantification from two independent experiments of panels A–B; bolded numbers were used for graph in panel C. Error bars represent STDEV.

