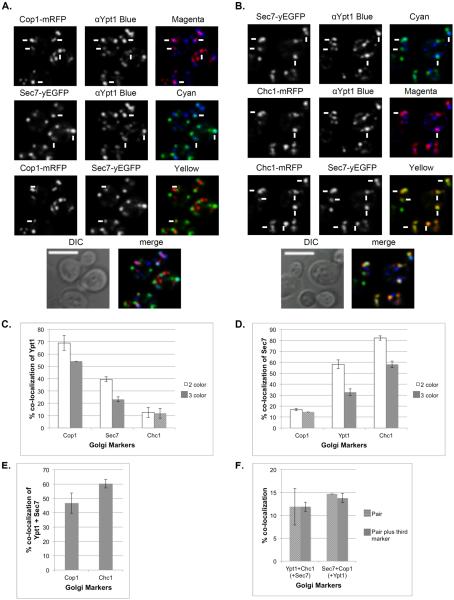
Figure 3. Distribution of Ypt1 on the Golgi using three-color IF microscopy.
A. Three-color fluorescence microscopy of Sec7, Ypt1 and Cop1. IF microscopy was performed with cells expressing Sec7-yEGFP and Cop1-mRFP, using anti-Ypt1 antibodies (secondary antibodies conjugated with α-Alexa-fluor 647, false colored blue). B. Three-color fluorescence microscopy of Sec7, Ypt1 and Chc1. IF microscopy was preformed with cells expressing Sec7-yEGFP and Chc1-mRFP, using anti-Ypt1 antibodies (secondary antibodies conjugated with α-Alexa-fluor 647, false colored blue). A–B, shown from top to bottom: 3 pairwise co-localizations (single colors, and 2-color merge: magenta for red and blue; cyan for green and blue; yellow for red and green), DIC and 3-color merge (white). White arrows point to co-localized signal in the 2-color merge; bar, 5μm. C. Ypt1 co-localizes mostly with Cop1. Pairwise co-localization of Ypt1 (%) with the Golgi markers is compared between two-color (from Figure 2, white bars) and three-color (this figure, grey bars) IF analyses. The two analyses show similar co-localization patterns. D. Increasing co-localization levels of Sec7 with Cop1, Ypt1 and Chc1. Pairwise co-localization of Sec7 (%) with the Cop1, Ypt1 and Chc1 is compared between two-color (from Figure 1 and Figure 2, white bars) and three-color (from this figure, grey bars) microscopy analyses. The two analyses show similar co-localization patterns. E. Ypt1-Sec7 puncta co-localize with Cop1 or Chc1. Three-color analysis shows that 47 and 60% of the Ypt1-Sec7 puncta also contain Cop1 and Chc1, respectively. F. Ypt1-Sec7: The slight co-localization of Sec7 with Cop1 and Ypt1 with Chc1 (~15%, striped bars in panels C and D, respectively) fully overlaps the other protein, Ypt1 and Sec7, respectively. Three-color analyses of Sec7-Cop1 with Ypt1 and Ypt1-Chc1 with Sec7 were performed. White bars show pairwise co-localization and grey bars show triple co-localization with the third marker: Ypt1 (left) and Sec7 (right). Error bars represent STDEV. Quantifications from two independent experiments are detailed in Table S1.

