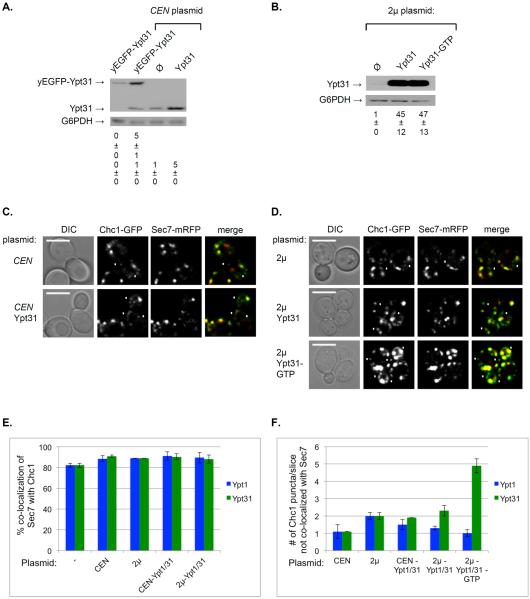
Figure 7. Higher number of Chc1 puncta that do not co-localize with Sec7 upon increased level and activity of Ypt31.
A. Expression of Ypt31 or yEGFP-Ypt31 from a CEN plasmid results in a 5-fold increase of its endogenous level. The levels of Ypt31 and yEGFP-Ypt31 proteins in cells expressing it from its endogenous locus or a CEN plasmid were determined using immuno-blot analysis and anti-Ypt31 antibodies. Left lane: ypt32Δ cells expressing yEGFP-Ypt31 from its endogenous promoter (used in Figure 5); CEN plasmid lanes: Cells (wild type) were transformed with a CEN plasmid expressing (from left to right): yEGFP-Ypt31, empty plasmid (Ø), and Ypt31 (from its native promoter and terminator). Shown top to bottom: yEGFP-Ypt31, Ypt31, G6PDH (loading control), quantification of yEGFP-Ypt31 (left lanes), and Ypt31 expressed as fold of endogenous level. B. Expression of Ypt31 from a 2μ plasmid results in a ~45-fold increase of its level. The level of Ypt31 was determined as described for panel A. Cells were transformed with a 2μ plasmid expressing from left to right: empty plasmid (Ø), Ypt31 and Ypt31-GTP (Ypt31-Q72L). Shown top to bottom: Ypt31, G6PDH (loading control), quantification of Ypt31 expressed as fold of endogenous level. C. The effect of expression of Ypt31 from a CEN plasmid on the co-localization of Sec7 and Chc1. Cells expressing Sec7-mRFP and Chc1-GFP from their endogenous loci were transformed with a CEN plasmid (from panel A): empty (top) and for Ypt31 expression (bottom) and visualized by live-cell microscopy. Shown from left to right: DIC, Chc1, Sec7 and merge (yellow). D. The effect of expression of Ypt31 from a 2μ plasmid on the co-localization of Sec7 and Chc1. Cells expressing Sec7-mRFP and Chc1-GFP from their endogenous loci were transformed with a 2μ plasmid (from panel B): empty (top), Ypt31 (middle) and Ypt31-GTP (bottom), and visualized by live-cell microscopy. Shown from left to right: DIC, Chc1, Sec7 and merge (yellow). Panels C–D: white arrowheads point to Chc1-GFP puncta that do not co-localize with Sec7-mRFP; bar, 5μm. E. The % co-localization of Sec7 with Chc1 does not change upon overexpression of Ypt1 (blue bars, from Figure S2A) or Ypt31 (green bars, Figure S3B). F. The number of Chc1 puncta that do not co-localize with Sec7 increases upon overexpression of Ypt31 (green bars, from this figure), but not Ypt1 (blue bars, Figure S2B). Shown from left to right in panels E–F: no plasmid (−), empty CEN and 2μ plasmids, expression of wild-type Ypt from CEN and 2μ, and Ypt-GTP from 2μ plasmids. Error bars and +/− represent STDEV. Quantifications from two independent experiments are detailed in Figures S2C and S3C.

