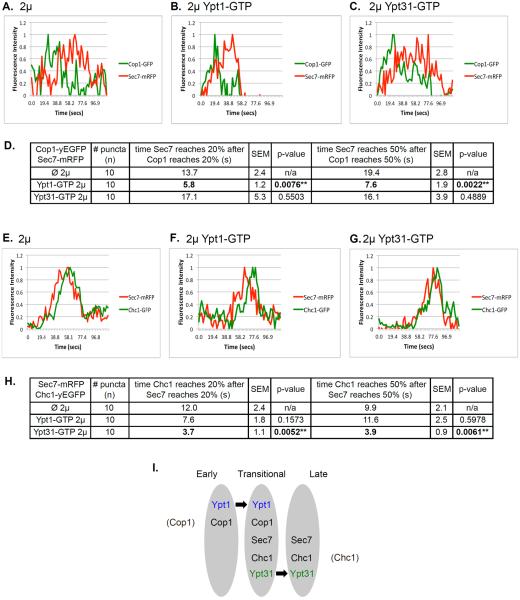
Figure 8. The effect of overexpression of activated Ypt1 and Ypt31 on Golgi cisternal progression.
Time-lapse fluorescence microscopy was done with two pairs of Golgi markers: Cop1-Sec7 (A–C) and Sec7-Chc1 (E–G). A–C: Overexpression of Ypt1-GFP, but not Ypt31-GFP, results in ~2.5 fold increase in the rate of Cop1-to-Sec7 conversion. Cells expressing Cop1-GFP and Sec7-mRFP from their endogenous loci were transformed with a 2μ plasmid (pRS425): empty (A), Ypt1-GTP (B), or Ypt31-GTP (C). D. Table shows quantifications from two independent experiments for panels A–C; bolded numbers show the significant change in Cop1-to-Sec7 conversion upon overexpression of Ypt1-GTP. E–G: Overexpression of Ypt31-GFP, but not Ypt1-GFP, results in ~2.5 fold increase in the rate of Sec7-to-Chc1 conversion. Cells expressing Sec7-mRFP and Chc1-GFP from their endogenous loci were transformed with a 2μ plasmid (pRS425): empty (E), Ypt1-GTP (F), or Ypt31-GTP (G). H. Table shows quantifications from two independent experiments for panels E–G; bolded numbers show the significant change in Sec7-to-Chc1 conversion upon overexpression of Ypt31-GTP. Cells were analyzed by time-lapse live-cell microscopy. Graphs show normalized fluorescence intensity of representative switching puncta over time (secs); bottom: average of time between markers reaching 20 and 50% of their total average fluorescence level (n=10); +/− represent STDEV, (**, p value <0.01). Three-channel kymographs of puncta used for panels A–C and E–G are shown in Figure S6. I. Model summarizing the roles of Ypt1 and Ypt31 on Golgi cisternal progression. Based on results presented here we propose that Ypt1 regulates early-to-transitional cisternal progression whereas Ypt31 facilitates transitional-to-late cisternal maturation (see text for discussion).

