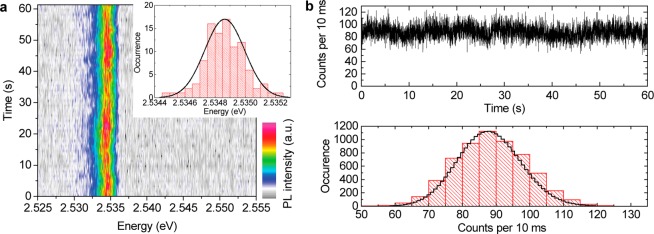
Figure 2.
(a) PL spectral time series shows spectral diffusion. The inset is a histogram of the peak energies, which is described well by a Gaussian distribution (black line). (b) PL intensity as a function of time shows blinking-free emission. The histogram in the lower plot follows a Poissonian intensity distribution (black line).

