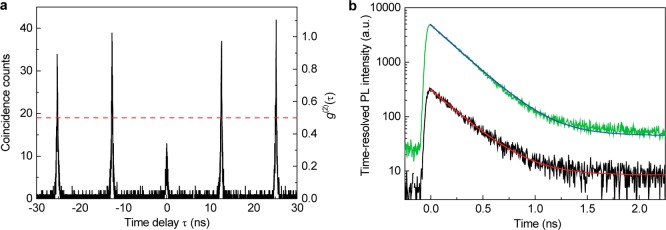
Figure 3.
(a) The photon correlation obtained in a Hanbury–Brown–Twiss configuration shows peaks every 12.5 ns when the laser pulses excite the QD. Each peak is described by a single-exponential decay on both sides, representing the PL decay times. Single photon emission is manifested by the correlation peak at τ = 0 being suppressed to g(2) = 0.3 below the antibunching threshold at g(2) = 0.5. The plot shows raw data without background subtraction or deconvolution. (b) Time-resolved photon emission as a function of time after the excitation pulse (without background subtraction). The linear slope in the logarithmic plot for two different excitation powers (0.8 μW, black and 7.5 μW, green) shows a power-independent single exponential decay over about 2 decades with a decay time of 250 ps (least-squares fits are red and blue, respectively).

