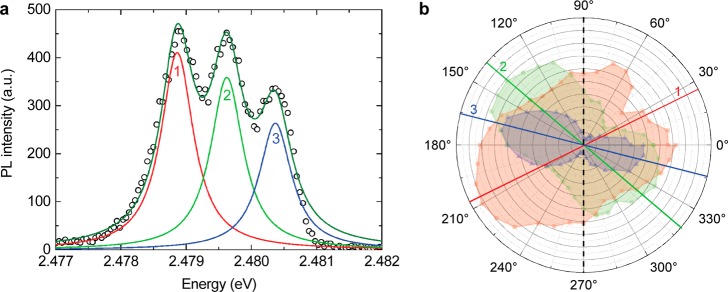
Figure 4.
(a) At low excitation power Pex and high spectral resolution with integration times of 10 s and a rotatable polarizer in the detection path, the PL spectrum reveals a complex fine structure. Three peaks (labeled 1, 2, 3) can be resolved. (b) The polarization of each of the three peaks is measured by rotating the linear polarizer. The polar plot shows the intensities at the respective peak emission energy as a function of polarizer angle.

