Figure 6.
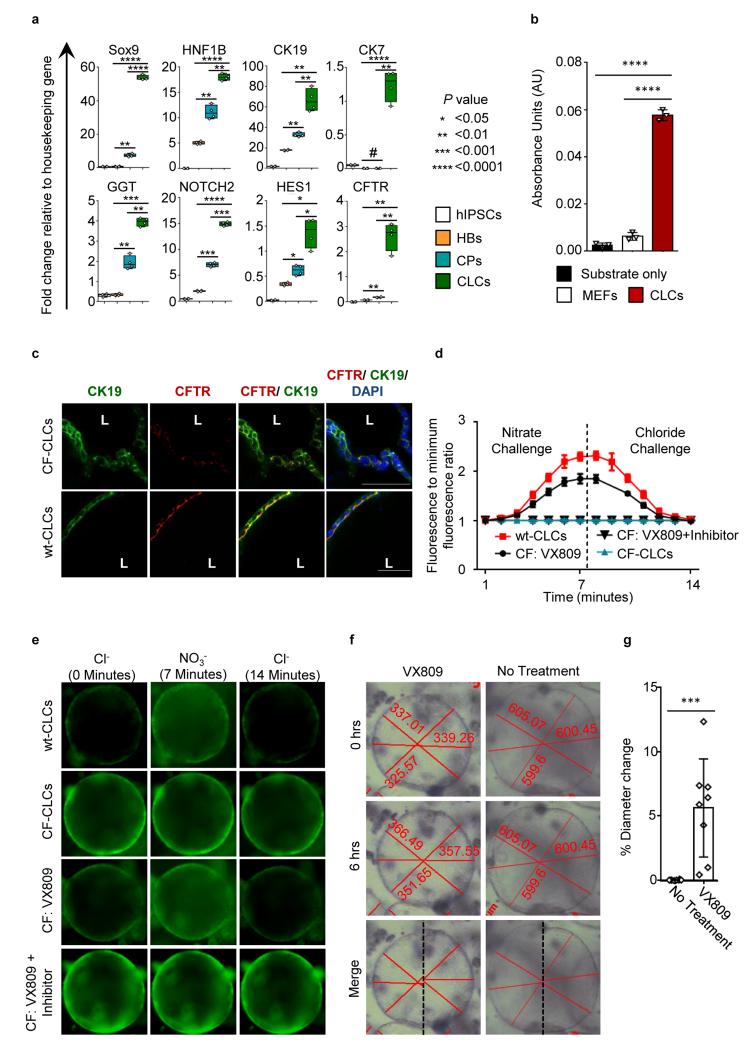
Modeling Cystic Fibrosis (CF) liver disease in vitro, using hiPSCs derived from patients with CF. (a) QPCR analyses of CLC organoids generated from CF-hiPSCs (CF-CLC), demonstrating the expression of biliary markers. Asterisks denote statistical significance in differences between HBs, CPs and CLCs (one-way ANOVA with Tuckey correction for multiple comparisons). (b) CFCLC organoids exhibit GGT activity. ****:P<0.0001 (one-way ANOVA with Dunnett correction for multiple comparisons). (c) IF analyses revealing very low CFTR protein expression in CF-CLC vs. wt-CLCs expressing CFTR. (d) MQAE fluorescence intensity normalized over the lowest intensity value. MQAE fluorescence is quenched in the presence of chloride, but not affected by nitrate. Changes in intracellular or intra-luminal chloride levels in response to extracellular chloride levels depend on the presence of CFTR functionality. MQAE fluorescence increases in response to a nitrate challenge depleting extracellular chloride and decreases in response to chloride in wt- and CFCLCs treated with VX809, however fails to respond to both challenges in CFCLCs and CF-CLCs treated with VX809 + CFTR inhibitor-172. (e) Live images demonstrating an increase in MQAE fluorescence in response to a nitrate challenge, followed by a decrease in response to a chloride challenge in wt-CLCs and CF-CLCs treated with VX809, however MQAE fluorescence remains unchanged in CF-CLCs and CF-CLCs treated with VX809 and CFTR inhibitor-172. (f) Live pictures demonstrating CLC organoids pre and post treatment with VX809. Diameter measurements are shown in each image. (g) Effect of VX809 treatment on mean organoid diameter. Error bars represent SD, n=8, P=0.001, (2-tailed t-test). Images cropped to include 1 cyst, but representative. All data shown is representative of 3 different experiments.

