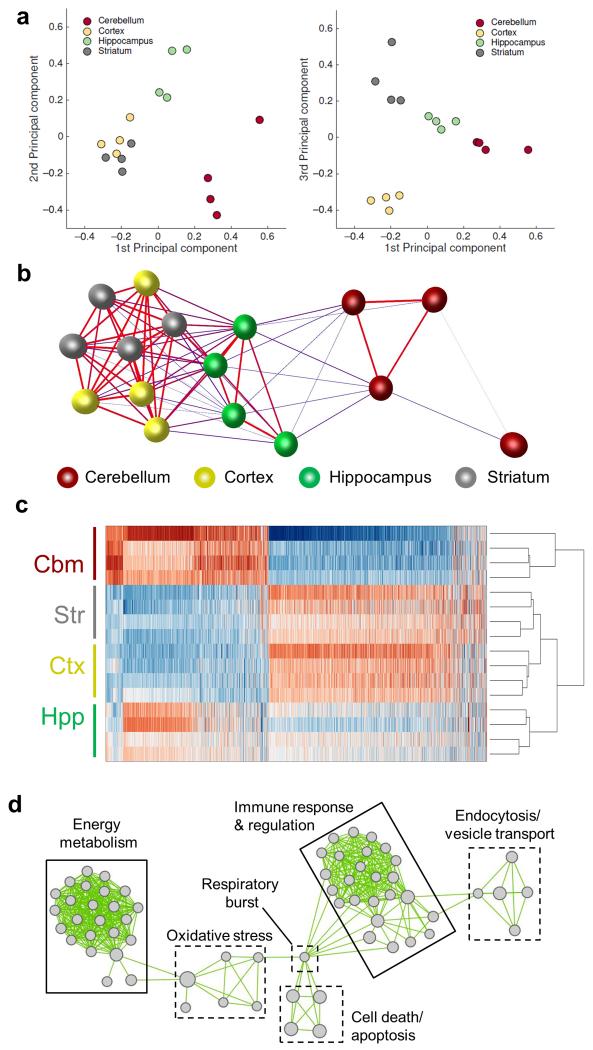
Figure 2.
The adult mouse microglial transcriptome is regionally heterogeneous. (a) Principal components analysis on microarray expression profiles for purified microglia from discrete brain regions. (b) Sample-to-sample correlation of microarray datasets was performed in BioLayout Express3D and a network graph generated (Pearson correlation threshold r ≥ 0.96). Nodes represent individual samples and edges the degree of correlation between them. (c) Heat map showing the expression pattern of probesets differentially expressed by brain region (p < 0.05 with FDR correction). The scaled expression value (row Z-score) is displayed in a blue-red colour scheme with red indicating high expression and blue low expression. (d) Differentially expressed probesets were analysed for enrichment of Gene Ontology (GO) Biological Processes in DAVID. Enriched GO terms were imported to Enrichment Map and a network graph generated. Nodes represent individual GO terms (gene sets) and edges the relatedness between them. Two major clusters defined by immunoregulatory and metabolic function were identified. Str, striatum; Hpp, hippocampus; Ctx, cerebral cortex; Cbm, cerebellum.

